
Mach7 Technologies Limited is an Australia-based medical imaging systems provider. The principal activity of the Company is the development and commercialization of medical imaging and data management software solutions for global healthcare enterprises. The core of these offerings is the Mach7 Enterprise Imaging Solution, encompassing Enterprise Data Management, Enterprise Diagnostic Viewing and Departmental Workflow applications. Mach7’s Enterprise Data Management solution consists of a Vendor Neutral Archive (VNA) and data administration tools, which allow for the fast storage, access, retrieval and viewing of images across a healthcare network with connectivity to the cloud. Enterprise Diagnostic Viewing offers healthcare professionals consolidated access to all patient images and data, ensuring clinical staff have timely access to the right information to diagnose and treat patients. It offers its solutions across North America, Asia Pacific, and the Middle East region.
Stock Overview — Key Metrics
Metric | Value |
|---|---|
Risk | Low to Medium |
Market Cap ($) | $70.50m |
Shares Outstanding | 235.01m |
Beta | 1.2692 |
EPS (TTM) | -0.0426 |
P/E (TTM) | — |
Dividend Yield (%) | — |
52-Week Range ($) | $0.245 – $0.685 |
Target Price ($) | $0.490 |
Stop Loss ($) | $0.210 |
Stock Performance Profile
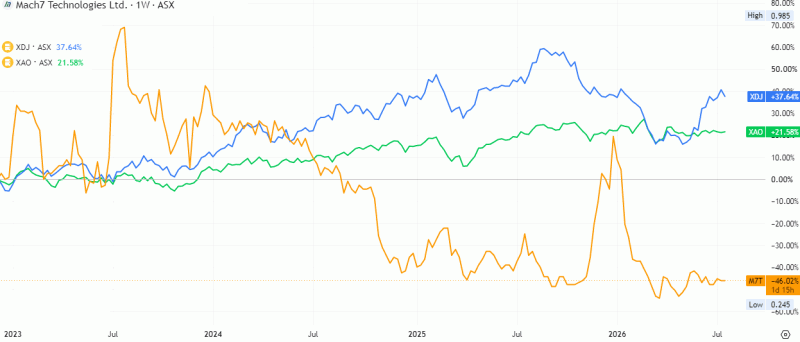
Source: TradingView
Financial Summary
Key Items | FY22 | FY23 | FY24 | FY25 |
|---|---|---|---|---|
Revenue ($m) | 26.389 | 30.063 | 29.126 | 33.786 |
EBITDA ($m) | (6.458) | 1.350 | (3.392) | (7.064) |
Net Income ($m) | (4.168) | (1.048) | (7.970) | (6.201) |
Financial Strength
Key Items | FY22 | FY23 | FY24 | FY25 |
|---|---|---|---|---|
Current Ratio | 2.4x | 2.2x | 2.1x | 2.2x |
Debt/Equity (%) | 2.0% | 2.4% | 2.5% | 2.5% |
Total Liabilities/Total Assets (%) | 27.7% | 29.0% | 29.0% | 27.9% |
Source: Company filings and historical analysis
The company delivered modest but resilient revenue growth over FY22–FY25, although profitability remained under pressure due to rising operating costs and weak operating leverage. Revenue increased from $26.4 million in FY22 to $33.8 million in FY25, representing a compound annual growth rate (CAGR) of approximately 8.6%. After growing by 13.9% in FY23, revenue softened marginally in FY24 before rebounding with a healthy 16.0% increase in FY25, suggesting continued market demand and business expansion. However, the revenue growth has not translated into earnings improvement, suggesting that the company is still in an investment or scale-up phase where operating expenses continue to outpace topline growth.
Operating profitability remained volatile throughout the period. The business recorded an EBITDA loss of $6.5 million in FY22, briefly returned to a positive EBITDA of $1.4 million in FY23, but slipped back into losses of $3.4 million in FY24 and $7.1 million in FY25. The deterioration in FY25 despite record revenue indicates increasing cost pressures, higher expenditure on growth initiatives, or declining operating efficiency. The inability to sustain positive EBITDA highlights that the business has yet to achieve sufficient scale to generate consistent operating cash profits.
Bottom-line performance followed a similar trend. Net losses narrowed significantly from $4.2 million in FY22 to $1.0 million in FY23, reflecting improved operational performance during that year. However, losses widened sharply to $8.0 million in FY24 before improving slightly to $6.2 million in FY25. The persistent net losses suggest that depreciation, financing costs, or increased investment spending continue to weigh on earnings despite revenue expansion. While The business still be loss-making, the modest improvement in FY25 relative to FY24 may indicate that management is beginning to stabilise costs.
From a balance sheet perspective, the company maintains a strong liquidity position. The current ratio remained consistently above 2.0x throughout the four-year period, ranging between 2.1x and 2.4x, suggesting that current assets comfortably exceed short-term liabilities. This level of liquidity provides sufficient financial flexibility to fund working capital requirements and absorb temporary operating losses without immediate funding stress.
Leverage remains exceptionally conservative. Debt-to-equity increased only marginally from 2.0% in FY22 to 2.5% in FY25, reflecting minimal reliance on debt financing. Such a low gearing profile substantially reduces refinancing and interest-rate risks while offering ample borrowing capacity should additional capital be required for future expansion. The stable capital structure also suggests that the company has primarily funded its operations through equity rather than debt.
Overall solvency metrics further reinforce the company's financial stability. Total liabilities accounted for only 27.7%–29.0% of total assets across the period, showing a healthy asset base supported predominantly by shareholders' equity. The slight reduction in liabilities-to-assets to 27.9% in FY25 indicates prudent balance sheet management despite ongoing operating losses.
Overall, the financial profile reflects a company with solid revenue momentum, a strong liquidity position, and a conservatively financed balance sheet, but one that still face challenges in converting revenue growth into sustainable profitability. The robust financial position provides management with the flexibility to continue investing in growth initiatives, although improving operating efficiency, controlling costs, and achieving consistent positive EBITDA will be critical to delivering long-term shareholder value.
Industry Overview
The Diagnostic Imaging Services industry provides healthcare practitioners with information about patients' health through X-rays, ultrasounds, magnetic resonance imaging (MRIs) and other imaging. Demand for these services is stronger among older people and has surged as Australia's population still age. Australia's growing population - combined with the rising prevalence of chronic disease among all age cohortsis also driving the need for diagnostic imaging services, including preventative diagnostic tests.
Trends and Insights:
The COVID-19 pandemic disrupted traditional growth patterns, which have been influenced by Australia's growing and ageing population. A steady increase in the number of diagnostic imaging items funded under Medicare has also underpinned recent industry growth. Diagnostic imaging services form an integral part of the healthcare system, helping to prevent, diagnose, treat and monitor injuries and illnesses. This means they are used by all age cohorts. The distribution of expenditure on diagnostic imaging services across Australia generally follows population distribution. The three eastern states account for 80% of all diagnostic imaging services undertaken each year. The users of diagnostic imaging services are generally referred by other medical professionals, primarily GPs and specialists. This influences the nature of industry competition.
Source: IBIS World
Risk Analysis
Mach7 Technologies operates in a highly competitive and rapidly evolving market, which presents several risks. One major risk is technological obsolescence; as healthcare IT systems advance, Mach7 must continuously innovate to keep pace with competitors and meet the evolving needs of healthcare providers. Additionally, the company's reliance on a limited number of large clients can lead to revenue volatility if these clients choose to switch vendors or reduce their spending. Regulatory changes in healthcare can also pose challenges, as compliance costs may rise and impact profitability. Furthermore, potential cybersecurity threats could compromise sensitive patient data, leading to reputational damage and financial penalties. These factors combined create a complex risk landscape that Mach7 must navigate to sustain growth and maintain its market position.
Outlook
Mach7 Technologies, a provider of enterprise imaging and data management solutions for healthcare, has a positive outlook influenced by increasing global demand for advanced healthcare IT solutions. The company’s strategic partnerships, expanding product portfolio, and recurring revenue from software licensing and support services position it well for future growth. As healthcare providers continue to prioritize efficiency and interoperability in imaging systems, Mach7's innovative platform could see increased adoption. However, the company may face competitive pressures from larger players in the sector, and its ability to maintain profitability amid R&D investments will be critical to sustaining long-term growth.
Historical Forecast and Assumptions
For FY26, Mach7 Technologies Ltd was expected to deliver solid revenue growth, underpinned by continued expansion of its enterprise imaging platform across North America, increasing software subscription and maintenance revenue, and a growing pipeline of cloud-based deployments. Revenue is forecast to increase by 12–18% year-on-year, influenced by new customer wins, contract renewals and greater adoption of its Vendor Neutral Archive (VNA) and eUnity diagnostic viewing solutions. As recurring revenue still represent a larger share of total sales, gross margins were expected to remain strong while disciplined cost management and operating leverage should support a meaningful improvement in EBITDA, with the company potentially returning to positive EBITDA and stronger operating cash flow during FY26. Although ongoing investment in product innovation, AI-enabled imaging capabilities and sales expansion may continue to weigh on net earnings, narrowing losses or modest profitability is achievable if contract conversion remains strong. Overall, FY26 is likely to be a transition year in which Mach7 strengthens its recurring revenue base, improves profitability and cash generation, and reinforces its position as a leading enterprise medical imaging software provider.
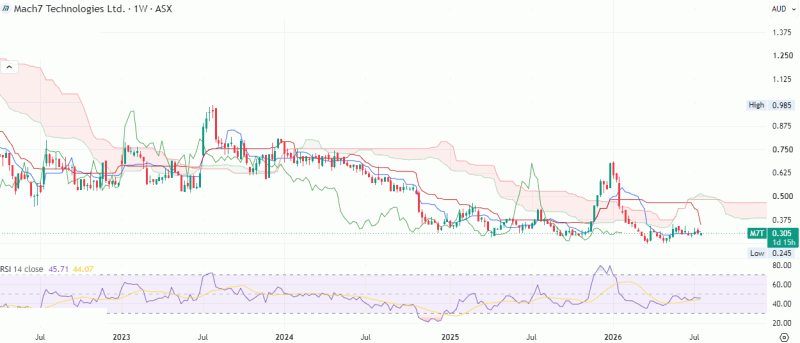
Technical Analysis
Historical Investment Assessment
Mach7 Technologies is well-positioned to benefit from the growing adoption of enterprise imaging and interoperable healthcare IT solutions, underpinned by its expanding recurring revenue base and strong presence in North America. Continued customer wins, cloud deployments, and increasing demand for its VNA and diagnostic imaging platforms were expected to drive solid revenue growth and improve operating leverage in FY26. While ongoing investments in AI capabilities, product innovation, and sales expansion may moderate near-term profitability, the company's strengthening cash generation, improving EBITDA profile, and scalable software business model provide a solid foundation for sustainable long-term growth. Technically, the stock is currently consolidating within a sideways range while maintaining a positive undertone, suggesting the formation of a strong base that could precede a fresh upward move. Following the sharp correction witnessed earlier this year, the counter has gradually stabilized and is exhibiting a sequence of higher levels, reflecting improving market sentiment. The prevailing price structure suggests the potential for sustained upside over the short to medium term. Momentum indicators, including RSI, MACD, and the 50day SMA, continue to reinforce the positive outlook. Any corrective decline should be viewed as a strategic accumulation opportunity within the prevailing trend. the original research recommended a “BUY” in the stock at cmp $0.305 (at closing rates of 22nd July 2026) with stop loss $0.210 and a target price of $0.490.
This page adapts a historical research document and retains the original report date, company data and contemporaneous views. Market prices, financial information, forecasts, targets, stop-loss levels and recommendations may be outdated and have not been independently verified or updated by Sharesrise. References to research opinions are descriptions of the historical source, not newly issued Sharesrise recommendations.
This material is general information only and does not take account of any individual’s financial objectives, situation or needs. Securities, particularly smaller-capitalisation companies, involve substantial risk, including loss of capital. Past performance is not a reliable indicator of future performance. Seek appropriate professional advice and review current ASX announcements before making decisions. Sharesrise must obtain legal/compliance approval of this disclosure and the report rights before public release; this text does not assert an AFSL, CAR or other authorisation.