
MinRex Resources Limited is an Australia-based mineral exploration and development company focused on discovering and advancing gold, silver, copper, lithium, tin, tantalum, and other base-metal projects. The company has a diverse portfolio spanning Western Australia and New South Wales. In Western Australia, MinRex holds 70% interests in the Marble Bar North, Marble Bar South, Daltons, and Bamboo Creek gold projects in the East Pilbara region, along with a 100% interest in the Deflector Extended Gold Project at Gullewa.
In New South Wales, MinRex holds seven exploration licences across the Mt Pleasant, Sofala, and Sunny Corner projects within the Lachlan Fold Belt. The company also has interests in lithium and tantalum exploration and farm-in rights covering several exploration licences, including up to 80% interests in EL7974 and EL7423 and a 90% interest in the exploration area of EL5964. Incorporated in 2011 and headquartered in Perth, MinRex still build a diversified exploration portfolio across prospective mineral regions of Australia.
Stock Overview — Key Metrics
Metric | Value |
|---|---|
Risk | Medium to High |
Market Cap ($) | $32.14m |
Shares Outstanding | 2.14bn |
Beta | 1.8653 |
EPS (TTM) | -0.0017 |
P/E (TTM) | — |
Dividend Yield (%) | — |
52-Week Range ($) | $0.008 – $0.025 |
Target Price ($) | $0.025 |
Stop Loss ($) | $0.010 |
Stock Performance Profile
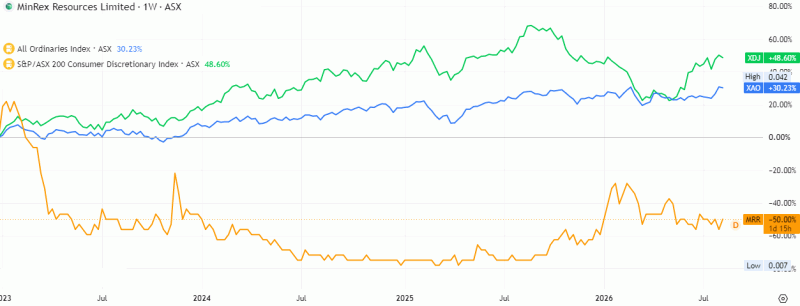
Source: TradingView
Financial Summary
Key Items | FY22 | FY23 | FY24 | FY25 |
|---|---|---|---|---|
Revenue ($m) | 168.6 | 164.3 | 165.0 | 163.7 |
EBIT ($m) | 157.9 | 154.2 | 155.1 | 153.0 |
Net Income ($m) | 133.8 | (79.1) | 131.5 | 200.1 |
Financial Strength
Key Items | FY22 | FY23 | FY24 | FY25 |
|---|---|---|---|---|
Current Ratio | 0.5x | 0.6x | 0.6x | 0.6x |
Debt/Equity (%) | 43.6% | 48.8% | 49.6% | 49.3% |
EBIT/Interest | 4.7x | 3.9x | 3.4x | 3.2x |
Source: Company filings and historical analysis
The company delivered a remarkably stable operating performance over FY22–FY25, with revenue remaining largely unchanged despite a challenging macroeconomic environment. Revenue declined marginally from $168.6 million in FY22 to $163.7 million in FY25, representing a modest compound annual decline of around 1.0%, suggesting resilient underlying demand but limited organic growth opportunities. The stability in revenue suggests that The business conducts operations in a mature business with predictable earnings rather than a high-growth industry.
Operating profitability remained exceptionally strong throughout the period. EBIT decreased slightly from $157.9 million in FY22 to $153.0 million in FY25, maintaining an EBIT margin exceeding 93% each year. Such consistently high operating margins indicate that the company has relatively low operating costs and generates substantial earnings from its core business. The minor decline in EBIT mirrors the slight reduction in revenue and suggests disciplined cost management despite inflationary pressures and higher financing costs.
Net income, however, exhibited considerable volatility. After reporting a healthy profit of $133.8 million in FY22, the company recorded a net loss of $79.1 million in FY23, despite only a marginal decline in revenue and EBIT. This indicates that the FY23 loss was most likely influenced by one-off non-operating items such as asset impairments, valuation adjustments, fair-value losses, or exceptional expenses rather than deterioration in core operations. The company's earnings rebounded strongly in FY24 with net profit recovering to $131.5 million, before increasing significantly to $200.1 million in FY25, the highest level during the period. The sharp improvement in FY25 suggests the presence of significant non-recurring gains, tax benefits, or investment-related income in addition to stable operating earnings.
From a liquidity perspective, the balance sheet remains relatively constrained. The current ratio improved modestly from 0.5x in FY22 to 0.6x from FY23 onwards, but remained below the conventional benchmark of 1.0x. This indicates that current liabilities continue to exceed current assets, suggesting reliance on stable operating cash flows, refinancing capacity, or revolving credit facilities to meet short-term obligations. While such liquidity levels may be acceptable for companies with predictable cash generation, they leave limited room to absorb unexpected working capital shocks.
Leverage remained relatively stable throughout the period. Debt-to-equity increased from 43.6% in FY22 to 49.6% in FY24 before easing slightly to 49.3% in FY25. Although gearing has edged higher over the four-year period, leverage remains at a moderate level and does not indicate excessive financial risk. The relatively stable debt profile suggests that management has maintained a disciplined capital structure while continuing to support shareholder returns or investment activities. Interest coverage, however, weakened steadily over the analysis period. EBIT-to-interest coverage declined from 4.7x in FY22 to 3.2x in FY25, reflecting either higher borrowing costs following interest rate increases or a greater interest burden from additional debt. Although the company still comfortably cover its interest obligations, the declining coverage ratio indicates reduced financial flexibility and highlights the importance of maintaining earnings stability should interest rates remain elevated.
Overall, the company's financial profile is characterised by highly stable revenues, consistently strong operating profitability, moderate leverage, and resilient cash-generating capability. The principal weaknesses remain below-average liquidity and declining interest coverage, while the volatility in net income appears largely attributable to non-operating or exceptional items rather than weakness in the underlying business. The strong rebound in earnings during FY24 and FY25 demonstrates the company's ability to recover from temporary disruptions, leaving it well positioned provided management still preserve operating margins, strengthen liquidity, and carefully manage financing costs.
Industry Overview
Exploration activity has remained volatile over the past few years because of fluctuating commodity prices and inflationary pressures. Supply chain disruptions influenced by the pandemic elevated commodity prices, spurring drilling activity to its peak of over 12.5 million metres drilled in 2021-22. However, as commodity prices softened and inflationary pressures mounted, the appetite for exploration activity has dampened, causing drilling activity to retreat from its peak and slump over the three years through 2024-25. However, this is on track to rise substantially in 2025-26. While drilling prices have plunged over the past two years, inflationary pressures, influenced by labour shortages and supply constraints, have lifted input costs. This has constrained exploration expenditure declines since 2022-23, even as activity remains subdued.
Key Regions and Targets
Western Australia: Dominates production and search efforts in the Pilbara and Eastern Goldfields for iron ore, gold, and lithium. South Australia: Noted for major poly-metallic and copper-gold deposits around the Gawler Craton. New South Wales & Queensland: Active exploration in provinces like the Cobar Basin and Bowen Basin for copper, gold, silver, and coal.
Technologies and Methods
Advanced Geophysics: Utilizing airborne and ground systems like TEMPEST for 3D subsurface conductivity mapping. Geochemical Innovations:Analyzing ultrafine particles in surface soils to detect deep footprints through heavy cover. Data Integration: Leveraging automated core logging and machine learning to build rapid 3D geological models.
Source: IBIS World
Risk Analysis
MinRex Resources Ltd faces elevated exploration and development risk as it remains an early-stage mineral explorer without producing assets or recurring operating cash flows. The company's valuation is highly dependent on successful exploration outcomes across its gold and battery metals projects in Western Australia and New South Wales, making it vulnerable to drilling disappointments, resource estimation uncertainty, permitting delays, and funding constraints. As a junior explorer, MinRex is also exposed to equity market conditions for capital raising, potential shareholder dilution, commodity price volatility, and inflationary pressures on exploration costs. Regulatory, environmental, and heritage approval requirements, together with competition for skilled labour and exploration services, could further affect project timelines and costs.
Outlook
The outlook for MinRex Resources remains cautiously optimistic, underpinned by its diversified portfolio of gold and battery metal exploration assets in prospective Australian jurisdictions. Continued drilling success, resource upgrades, and strategic partnerships or farm-in agreements could unlock significant shareholder value and improve funding opportunities. Rising long-term demand for critical minerals associated with the global energy transition also provides a supportive backdrop for its battery metals portfolio. However, nearterm performance will largely depend on exploration results, prudent capital management, and the company's ability to secure financing while advancing priority projects toward defined mineral resources and potential development milestones.
Historical Forecast and Assumptions
For FY26, MinRex Resources Ltd was expected to remain in the exploration and project development stage, with no meaningful operating revenue as the company prioritizes resource expansion and technical studies across its gold, silver, and copper assets. Expenditure is likely to increase moderately as drilling programs, metallurgical testing, environmental studies, and project advancement activities accelerate, resulting in a wider net loss that is typical for an exploration company. However, the company's financial position was expected to remain underpinned by existing cash reserves and disciplined capital management, enabling it to fund planned exploration without immediate production cash flows. Key value drivers during FY26 will be continued resource growth, updated project economics, successful drilling outcomes, and progress toward development milestones, particularly at its flagship assets, while elevated precious metal prices could enhance project economics and investor sentiment. Overall, FY26 was expected to be a transformational investment year focused on de-risking assets and increasing long-term shareholder value rather than generating earnings, with exploration success and funding capacity remaining the principal determinants of future performance.
Technical Analysis
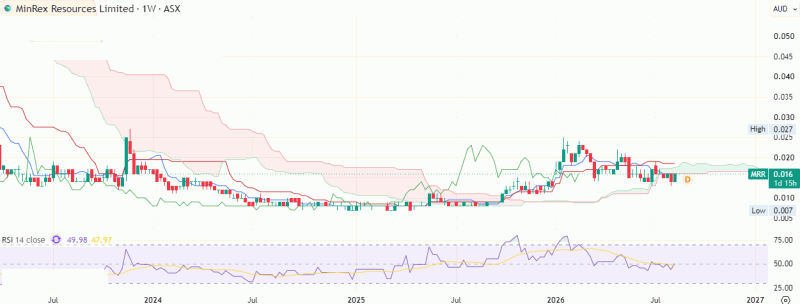
Source: TradingView
Historical Investment Assessment
MinRex Resources offers an optimistic exploration-led growth opportunity, underpinned by a diversified portfolio of gold, silver, copper and battery-metal assets across highly prospective Australian regions. FY26 could be a pivotal year as drilling, resource upgrades and technical studies advance key projects and potentially unlock substantial value. Strong exploration results, rising precious and critical mineral prices, and strategic partnerships or farm-in agreements could further strengthen the company’s position. While funding and exploration risks remain, successful project de-risking and resource growth could significantly improve investor sentiment and create meaningful long-term shareholder value. Technically, the stock is currently consolidating within a sideways range while maintaining a positive bias, suggesting limited downside potential from prevailing levels. Recent price action has shifted upward and established a higher low, reflecting improving buying interest and suggesting that the underlying bullish momentum could remain intact over the short to medium term. The formation of a saucer pattern, followed by a bullish flag pattern, further strengthens the constructive technical setup and indicates potential for an upside breakout in the coming weeks. Momentum oscillators, including RSI and MACD, remain positively aligned and comfortably positioned, reinforcing the broader bullish outlook. the original research recommended a “BUY” at the closing price of $0.016 (as of 12th August 2026) with stop loss $0.010 for target $0.025.
This page adapts a historical research document and retains the original report date, company data and contemporaneous views. Market prices, financial information, forecasts, targets, stop-loss levels and recommendations may be outdated and have not been independently verified or updated by Sharesrise. References to research opinions are descriptions of the historical source, not newly issued Sharesrise recommendations.
This material is general information only and does not take account of any individual’s financial objectives, situation or needs. Securities, particularly smaller-capitalisation companies, involve substantial risk, including loss of capital. Past performance is not a reliable indicator of future performance. Seek appropriate professional advice and review current ASX announcements before making decisions. Sharesrise must obtain legal/compliance approval of this disclosure and the report rights before public release; this text does not assert an AFSL, CAR or other authorisation.