
OFX Group Limited is an Australia-based financial services company specialising in international payments and foreign exchange solutions for both individuals and businesses. The company enables clients to send and receive money globally in a secure, cost-efficient manner, positioning itself as an alternative to traditional banking channels. With operations spanning key regions including APAC, North America, and EMEA, OFX caters to a diverse client base such as consumers, corporates, online sellers, and large enterprises. Its global presence is underpinned by offices in major financial hubs like London, Sydney, Hong Kong, Singapore, Toronto, and San Francisco, allowing it to deliver localized expertise with a global reach.
A key offering of OFX is its Global Currency Account, designed to simplify cross-border financial management for businesses, especially those involved in international trade and eCommerce. This solution allows clients to hold and manage multiple foreign currency accounts, facilitating seamless payments, collections, and reconciliation across different currencies such as euros, dollars, and yen. In addition to its digital platform—accessible via web and mobile—the company provides dedicated support through its “OFXperts,” who offer tailored guidance and customized solutions based on client needs. This blend of technology-driven services and human expertise strengthens OFX’s value proposition in the competitive global payments landscape.
Stock Overview — Key Metrics
Metric | Value |
|---|---|
Risk | Low to Medium |
Market Cap ($) | $119.33m |
Shares Outstanding | 231.71m |
Beta | 0.5560 |
EPS (TTM) | 0.0671 |
P/E (TTM) | 7.67 |
Dividend Yield (%) | — |
52-Week Range ($) | $0.460 – $1.335 |
Target Price ($) | $0.825 |
Stop Loss ($) | $0.360 |
Stock Performance Profile
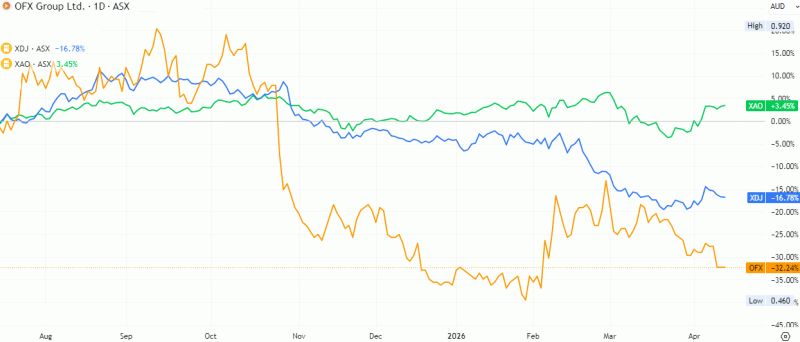
Source: TradingView
Financial Summary
Key Items | FY22 | FY23 | FY24 | FY25 |
|---|---|---|---|---|
Revenue ($m) | 158.4 | 228.9 | 242.7 | 231.4 |
EBITDA ($m) | 34.1 | 45.7 | 46.0 | 32.4 |
Net Income ($m) | 25.0 | 31.4 | 31.3 | 24.9 |
Financial Strength
Key Items | FY22 | FY23 | FY24 | FY25 |
|---|---|---|---|---|
Current Ratio | 1.2x | 1.3x | 1.2x | 1.3x |
EBITDA / Interest | 8.3x | 7.5x | 7.7x | 5.6x |
Debt/Equity | 54.9% | 33.2% | 18.1% | 16.7% |
Source: Company filings and historical analysis
The company delivered strong top-line growth over the four-year period, with revenue increasing from $158.4m in FY22 to $231.4m in FY25, representing a 46.1% cumulative rise. Growth was especially strong in FY23, where revenue expanded by 44.5%, followed by a more moderate increase in FY24 to $242.7m, before a slight 4.7% decline in FY25. This suggests that after a rapid expansion phase, the business may have entered a period of normalization or softer market demand in FY25. Despite the small revenue pullback, the overall scale of operations remains materially above FY22 levels, suggesting that the company has successfully expanded its market presence.
From an earnings perspective, EBITDA improved from $34.1m in FY22 to $46.0m in FY24, before declining sharply to $32.4m in FY25. The EBITDA margin trend reflects this movement, improving from approximately 21.5% in FY22 to 19.9% in FY23, stabilizing near 19.0% in FY24, and then dropping to around 14.0% in FY25. This margin compression in FY25 suggests increased operating costs, weaker pricing power, or investment-related expenses that outpaced revenue generation. The decline in profitability at the EBITDA level is significant because it came despite revenue remaining relatively strong, implying pressure on operational efficiency.
Net income remained resilient overall, rising from $25.0m in FY22 to $31.4m in FY23, staying broadly flat at $31.3m in FY24, and then easing to $24.9m in FY25. While the FY25 decline mirrors the EBITDA softness, net profit is still broadly in line with FY22 levels, showing a degree of earnings stability. Net margin remained healthy throughout the period, averaging around 12–14%, which indicates that the business still convert a solid portion of revenue into bottom-line profit even during a weaker year.
The balance sheet strength improved materially across the four years. The current ratio remained stable between 1.2x and 1.3x, suggesting consistent short-term liquidity and an adequate ability to meet working capital obligations. More importantly, the company significantly deleveraged, with debt-to-equity falling from 54.9% in FY22 to just 16.7% in FY25. This is an excellent indicator of improving financial resilience, lower balance sheet risk, and stronger equity support for future growth initiatives.
Interest servicing capacity, while still healthy, showed some softening. EBITDA-to-interest cover declined from 8.3x in FY22 to 5.6x in FY25, largely due to the EBITDA drop in FY25. Even at 5.6x, coverage remains comfortable and indicates no immediate solvency concern, but the downward trend should be monitored as it may signal either rising borrowing costs or weaker earnings support for debt servicing.
Overall, the company shows a strong long-term growth profile, improved leverage, and stable liquidity, although FY25 reflects margin pressure and reduced earnings momentum. The sharp improvement in debt metrics provides a strong foundation, and if management can restore EBITDA margins closer to FY23–FY24 levels, the business appears well-positioned for renewed earnings growth.
Industry Overview
The Custody, Trustee and Stock Exchange Services has experienced dynamic shifts influenced by globalisation, digital revolution and market volatility over the past few years. Although the number of stock market trades has climbed, investors and superannuation funds have gravitated towards international markets to diversify their portfolios over the past few years, slowing revenue growth for domestic stock exchanges and share registry services. Despite the trend, a rebound in IPO activity over the past few years signals a potential revival in interest in domestic stock exchanges.
Source: IBIS World
Risk Analysis
OFX Group Ltd faces a mix of transaction-volume, margin, regulatory, and execution risks. As a crossborder payments and FX platform, earnings are highly sensitive to global trade flows, SME payment activity, and currency market volatility; softer client activity in key corridors can quickly pressure fee income and spreads. FY25 already reflected this with net operating income declining and EBITDA margins compressing, illustrating operating leverage risk when volumes soften. In addition, OFX operates across multiple jurisdictions, so tighter AML/KYC, payments licensing, and consumer-protection rules could increase compliance costs and slow customer onboarding. Competitive pressure from fintechs, banks, and low-cost payment disruptors also threatens pricing power, while the ongoing transition to its “OFX 2.0” platform introduces technology execution risk, where delays or weaker customer migration could affect growth and margins.
Outlook
The medium-term outlook for OFX remains cautiously constructive, underpinned by its ongoing platform modernisation, increasing focus on SME and enterprise segments, and improving customer monetisation strategies. Management’s ambition to deliver double-digit net operating income growth alongside structurally higher EBITDA margins reflects confidence in scaling higher-value clients, enhancing digital onboarding, and deepening wallet share in business payments. As the company progresses with its OFX 2.0 transformation, greater automation and operating efficiencies were expected to gradually strengthen margins and improve overall operating leverage.
In the near term, however, the recovery trajectory is likely to remain measured as the company navigates platform transition challenges and softer transaction activity in certain corridors. FY26 is shaping up to be a rebuilding phase, where execution will be critical—particularly in retaining SME clients, restoring transaction growth, and ensuring a seamless migration to the new platform. If these strategic levers gain traction, OFX is well-positioned to transition into a stronger growth cycle, with the scope to deliver sustainable double-digit earnings expansion from FY27 onward.
Historical Forecast and Assumptions
For FY26, OFX Group Ltd was expected to deliver a stabilisation-driven performance rather than a sharp rebound, with net operating income projected in the range of A$218–222 million and underlying EBITDA between A$30–34 million. This implies an EBITDA margin of approximately 14–15%, reflecting gradual recovery dynamics. The outlook assumes a stronger second half relative to the first, underpinned by improving enterprise client momentum, easing platform migration friction, and a gradual normalisation in transaction volumes following a softer first half performance.
Cash flow generation was expected to remain resilient, with free cash flow estimated at A$18–22 million, underpinned by the company’s low capital intensity despite ongoing investments in technology and platform enhancement. Margins may continue to trail long-term targets in the near term due to continued rollout costs of OFX 2.0 and cautious consumer activity. Overall, FY26 is likely to mark a transition and consolidation year, laying the groundwork for stronger operating leverage and accelerated earnings growth in FY27, contingent on sustained scaling in enterprise and B2B payment volumes.
Technical Analysis
Historical Investment Assessment
OFX is steadily positioning itself for a structured recovery, influenced by platform modernisation, a stronger focus on SME and enterprise clients, and improving monetisation capabilities. The ongoing transition to OFX 2.0 was expected to enhance scalability, efficiency, and customer experience, supporting margin expansion over time. Management’s clear medium-term targets reinforce confidence in sustainable growth and operating leverage. FY26 is set to be a foundational year, with improving transaction momentum and execution laying the groundwork. As these initiatives gain traction, OFX is well placed to deliver consistent and stronger earnings growth in the periods ahead. Technically, the stock has been consolidating within a defined range following its recent positive performance, while the broader long-term outlook remains constructive. Medium-term price action on the weekly timeframe indicates that the higher high–higher low structure remains intact, suggesting sustained upward momentum over the short to medium term. Additionally, the stock is transitioning from oversold conditions toward neutral territory, reflecting improving momentum dynamics. This normalisation phase is likely to support incremental upside, with price action potentially resuming its upward trajectory in the coming months, backed by strengthening technical indicators and underlying buying interest. the original research recommended a “BUY” at the closing price of $0.515 (as of 15th April 2026) with stop loss $0.360 for target $0.825.
This page adapts a historical research document and retains the original report date, company data and contemporaneous views. Market prices, financial information, forecasts, targets, stop-loss levels and recommendations may be outdated and have not been independently verified or updated by Sharesrise. References to research opinions are descriptions of the historical source, not newly issued Sharesrise recommendations.
This material is general information only and does not take account of any individual’s financial objectives, situation or needs. Securities, particularly smaller-capitalisation companies, involve substantial risk, including loss of capital. Past performance is not a reliable indicator of future performance. Seek appropriate professional advice and review current ASX announcements before making decisions. Sharesrise must obtain legal/compliance approval of this disclosure and the report rights before public release; this text does not assert an AFSL, CAR or other authorisation.