
Pengana Capital Group Limited is an Australia-based funds management company. The Company’s investment objective is to increase the investor wealth by developing, offering, and managing investment funds in Australia and globally. The business concentrates on various investment strategies that aims to deliver long-term risk-adjusted returns to investors, with a focus on capital preservation. Its investment funds include Axiom International Funds, Harding Loevner International Fund, Australian Equities Fund, Pengana International Equities Limited, Global Small Companies Fund, Emerging Companies Fund, Pengana Global Private Credit Trust, Pengana Private Equity Trust, WHEB Sustainable Impact Fund, High Conviction Equities Fund, High Conviction Property Securities Fund, Alpha Israel Fund, and Pengana Diversified Private Credit Fund. The Company’s subsidiaries include Pengana Holdings Pty Ltd, Pengana Capital Ltd, Pengana Investment Management Ltd, Pengana USA Holdings Inc., and others.
Stock Overview — Key Metrics
Metric | Value |
|---|---|
Risk | Low to Medium |
Market Cap ($) | $73.48m |
Shares Outstanding | 97.98m |
Beta | 0.3692 |
EPS (TTM) | 0.0081 |
P/E (TTM) | 92.71 |
Dividend Yield (%) | 5.84% |
52-Week Range ($) | $0.650 – $0.900 |
Target Price ($) | $1.235 |
Stop Loss ($) | $0.540 |
Stock Performance Profile
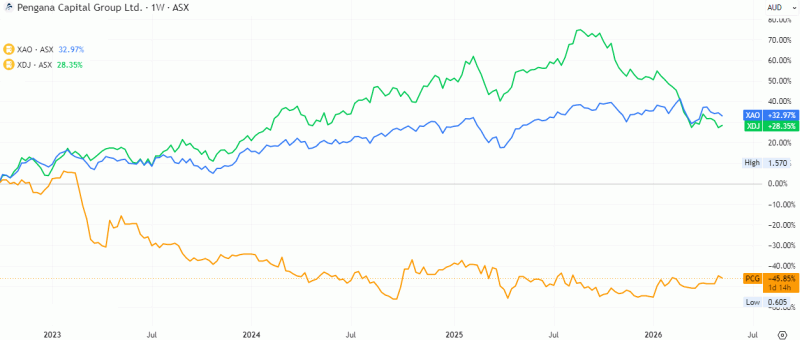
Source: TradingView
Financial Summary
Key Items | FY22 | FY23 | FY24 | FY25 |
|---|---|---|---|---|
Revenue ($m) | 76.026 | 38.263 | 40.476 | 60.379 |
EBITDA ($m) | 32.955 | 4.640 | (4.041) | 8.972 |
Net Income ($m) | 18.652 | (0.489) | (4.347) | 2.610 |
Financial Strength
Key Items | FY22 | FY23 | FY24 | FY25 |
|---|---|---|---|---|
Current Ratio | 2.3x | 2.7x | 1.2x | 1.6x |
EBITDA / Interest | NM | 29.3x | NM | 86.2x |
Debt/Equity | 1.8% | 4.6% | 3.9% | 2.4% |
Source: Company filings and historical analysis
1. Revenue Analysis
The company’s revenue trend shows significant volatility across the four years.
FY22: Revenue stood at $76.0 million, representing a strong base year. FY23: A sharp decline to $38.3 million (?49.7%) reflects operational disruptions or lower sales volume—possibly due to external factors such as market downturn or supply constraints. FY24: Revenue marginally improved to $40.5 million (+5.8%), suggesting stabilization after the prior decline. FY25: A notable rebound to $60.4 million (+49.2%) indicates recovery in sales performance and demand revival.Overall, FY25 marks a return to a growth trajectory after two years of subdued performance.
2. Profitability Analysis
EBITDA and Net Income show a clear pattern of volatility tied to operating efficiency and cost control.
FY22: EBITDA was $32.96 million (margin ? 43%), and net income $18.65 million, signaling strong profitability and high-margin operations. FY23: EBITDA plummeted to $4.64 million (margin ? 12%), while net income turned slightly negative at –$0.49 million, pointing to pressure from declining revenue and potential cost overruns. FY24: Negative EBITDA of –$4.04 million and net loss of –$4.35 million underscore a challenging year, likely characterized by higher expenses, one-off impairments, or weak pricing. FY25: EBITDA rebounded sharply to $8.97 million, and net income recovered to $2.61 million, showing that cost optimization and revenue recovery efforts yielded results.
The turnaround in FY25 suggests renewed operational discipline and potentially improved market conditions, though the company’s profitability remains below its FY22 peak.
3. Financial Strength & Liquidity
The current ratio shows the company’s short-term liquidity position:
It was strong in FY22 (2.3x) and improved to 2.7x in FY23, suggesting ample liquidity. However, it dropped sharply to 1.2x in FY24, reflecting tighter working capital and possible strain on current assets. FY25 shows recovery to 1.6x, suggesting improved liquidity management but still below earlier comfort levels.
The Debt/Equity ratio remained consistently low (ranging between 1.8% and 4.6%), reflecting a conservative capital structure and minimal leverage risk. The company appears to rely primarily on equity financing, giving it flexibility to withstand earnings volatility.
4. Interest Coverage & Solvency
Interest coverage (EBITDA/Interest) further supports the strong solvency profile:
In FY23, coverage stood at 29.3x, reflecting ample capacity to service debt. In FY25, it improved dramatically to 86.2x, suggesting restored profitability and strong interest coverage. The metric was not meaningful (NM) in FY22 and FY24 due to either negligible interest expense or negative EBITDA.
Overall, the company has no significant debt-servicing risk, consistent with its low leverage.
5. Overall Financial Performance
Across FY22–FY25, the company transitioned through four distinct phases:
FY22: High growth and profitability year with strong cash generation. FY23–FY24: Downturn marked by revenue contraction and operating losses. FY25: Recovery phase with growth resumption, positive cash flow, and strengthened financial ratios.
While FY25 results are encouraging, the company must maintain this operational turnaround, manage costs prudently, and focus on restoring historical EBITDA margins. The robust financial position and improving liquidity position provide a stable platform for sustained growth over the years ahead.
Industry Overview
Financial asset investors have benefited from a generally strong domestic share market performance and robust profit margins over the past few years. Typically, industry funds are invested in equities, and industry revenue depends on various share market performances. The COVID-19 pandemic and ensuing inflationary pressures significantly disrupted both local and global equity markets, which limited industry performance. Yet, total assets have continued to accumulate over recent years, compounding returns for investors, assisted by previously low interest rates. Overall, industry revenue was expected to climb at an annualised 3.2% over the five years through 2025-26, to $206.5 billion.
Trends and Insights
Total industry assets have continued to accumulate despite economic headwinds. Previously, low interest rates and an appetite for investment boosted interest in investment vehicles in recent years. The most common products offered in the Financial Asset Investing industry are unit trusts, whereby the general public can invest in the trust by purchasing units. The trust then manages the funds and invests them into various assets. New South Wales and Victoria account for the highest amounts of financial asset investing activity. The volume and variety of potential clients are big motivators for financial asset investors to set up shop in these places. The majority of financial asset investors earn less than $200,000 annually. Many small-scale investors use financial assets to diversify their portfolios.
Source: IBIS World
Risk Analysis
Pengana’s key risks stem primarily from its exposure to global financial markets and its funds management business model, where earnings are closely tied to funds under management (FUM) and investment performance; any sustained market downturn, volatility, or underperformance of its actively managed strategies can reduce fee income and investor inflows. The firm also faces manager risk due to its structure of independent specialist investment teams—poor performance or turnover among these teams could impact product credibility and client retention. Additionally, concentration risk exists in niche strategies such as private equity and private credit, which can be less liquid and harder to value during stressed conditions. Regulatory changes in financial services, especially around disclosure, fee structures, and responsible investing, could increase compliance costs and constrain operations. Competitive pressure from low-cost passive funds and large asset managers also poses a structural threat to margins and growth, particularly as investors increasingly favor cheaper index-based products.
Outlook
The outlook for Pengana Capital Group Ltd remains moderately positive, underpinned by its diversified product suite across equities, private equity, and private credit, and its focus on differentiated, actively managed strategies aimed at long-term risk-adjusted returns. Growth is likely to be influenced by increasing investor demand for alternative assets such as private credit and global private equity, which are gaining traction as income-generating and diversification tools. The firm’s global investment footprint and specialist manager model provide access to unique opportunities and can support alpha generation if performance remains consistent. However, near-term performance will remain sensitive to equity market conditions and investor sentiment, meaning earnings may fluctuate with macroeconomic cycles. Over the medium term, sustained FUM growth, expansion in higher-margin alternative strategies, and continued alignment between managers and investors should support gradual revenue and profitability improvement, provided investment performance remains competitive.
Historical Forecast and Assumptions
Pengana Capital Group Ltd was expected to deliver a moderate recovery in FY26, influenced by improving performance fees, growth in higher-margin private credit strategies, and stabilisation in funds under management (FUM). Following softer FY25 performance fees and a temporary downgrade to earnings expectations, we anticipate earnings growth momentum to resume, with EPS recovery underpinned by funds nearing high-water marks and stronger fee realisation. Operationally, early FY26 trends show positive momentum, including ~8.6% FUM growth to ~$3.8bn and a ~17% rise in net base revenue run rate, alongside a near doubling of base EBITDA, reflecting scalability and margin expansion. However, short-term volatility in FUM (e.g., decline to ~$3.59bn in March 2026) may create some revenue pressure. Overall, FY26 revenue is likely to grow in the high-single-digit to low-double-digit range, with EBITDA margins improving and net profit rebounding meaningfully, underpinned by performance fees and cost discipline, while strong cash generation should sustain attractive dividend yields (~8–10%) and potential buybacks, positioning the company for a valuation re-rating if execution remains consistent.
Technical Analysis
Historical Investment Assessment
Pengana Capital Group Ltd appears well-positioned for a stronger FY26, underpinned by improving funds under management, recovery in performance fees, and expanding higher-margin private credit and alternative asset strategies. The company’s diversified investment platform, global manager network, and scalable operating model provide a solid foundation for earnings growth and margin expansion. Early FY26 operational trends, including rising FUM and stronger EBITDA momentum, indicate improving business performance. With disciplined cost management, strong cash generation, and attractive dividend potential, Pengana could benefit from a meaningful earning rebound and valuation re-rating if market conditions remain supportive and execution stays consistent. Technically, the stock witnessed persistent weakness over the past year, accompanied by sustained selling pressure in recent months, reflecting a broader bearish trend. However, current price action indicates the emergence of a potential technical rebound, commonly characterized as a “dead cat bounce” following an extended decline. The formation of higher highs and higher lows suggests improving near-term sentiment and the possibility of short-term trend stabilization. Additionally, both RSI and MACD remain in oversold territory, increasing the likelihood of a short-covering rally. The recent upside breakout further strengthens the bullish recovery outlook, with expectations of continued upward momentum over the next few months. the original research recommended a “Buy” at the closing price of $0.770 (as on 13th May 2026) with stop loss $0.540 and target of $1.235.
This page adapts a historical research document and retains the original report date, company data and contemporaneous views. Market prices, financial information, forecasts, targets, stop-loss levels and recommendations may be outdated and have not been independently verified or updated by Sharesrise. References to research opinions are descriptions of the historical source, not newly issued Sharesrise recommendations.
This material is general information only and does not take account of any individual’s financial objectives, situation or needs. Securities, particularly smaller-capitalisation companies, involve substantial risk, including loss of capital. Past performance is not a reliable indicator of future performance. Seek appropriate professional advice and review current ASX announcements before making decisions. Sharesrise must obtain legal/compliance approval of this disclosure and the report rights before public release; this text does not assert an AFSL, CAR or other authorisation.