
Prescient Therapeutics Limited is an Australian clinical-stage biotechnology company focused on developing innovative precision oncology therapies for the treatment of difficult-to-treat cancers. Headquartered in Melbourne, the company is advancing a pipeline of targeted drug candidates designed to address unmet medical needs in both solid tumors and hematological malignancies. Its research strategy centers on developing therapies that interfere with key cancer-driving pathways, with the goal of improving patient outcomes while expanding treatment options for aggressive cancers.
The company's lead programs include PTX-200, which is being evaluated across multiple clinical trials for HER2-negative breast cancer, relapsed and refractory acute myeloid leukemia (AML), and platinum-resistant ovarian cancer, and PTX-100, a first-in-class RhoA inhibitor targeting cancers associated with Ras and RhoA mutations. Prescient is also expanding its immunotherapy capabilities through a strategic collaboration with The University of Texas MD Anderson Cancer Center to develop blood cancer applications for its OmniCAR platform. By combining targeted therapies with next-generation cell therapy technologies, the company aims to build a diversified oncology pipeline with significant long-term commercial potential.
Stock Overview — Key Metrics
Metric | Value |
|---|---|
Risk | Medium to High |
Market Cap ($) | $96.73m |
Shares Outstanding | 1.05bn |
Beta | 0.2656 |
EPS (TTM) | -0.01 |
P/E (TTM) | — |
Dividend Yield (%) | — |
52-Week Range ($) | $0.040 – $0.125 |
Target Price ($) | $0.150 |
Stop Loss ($) | $0.060 |
Stock Performance Profile
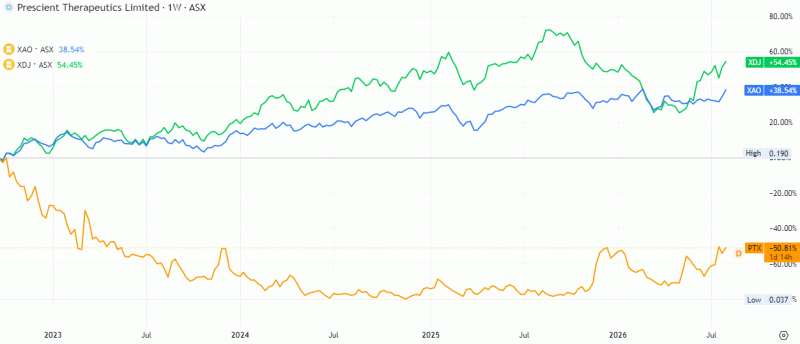
Source: TradingView
Financial Summary
Key Items | FY22 | FY23 | FY24 | FY25 |
|---|---|---|---|---|
Revenue ($m) | 1.889 | 2.428 | 3.712 | 4.356 |
EBITDA ($m) | (5.209) | (7.456) | (7.186) | (7.535) |
Net Profit ($m) | (5.117) | (7.005) | (8.238) | (7.323) |
Key Financial Ratios
Key Items | FY22 | FY23 | FY24 | FY25 |
|---|---|---|---|---|
Current Ratio | 12.2x | 8.1x | 4.1x | 13.0x |
Total Liabilities/Total Assets | 7.2% | 11.4% | 21.8% | 8.2% |
The company demonstrated strong top-line growth over the FY22–FY25 period, with revenue increasing from $1.89 million in FY22 to $4.36 million in FY25, representing a compound annual growth rate (CAGR) of approximately 32%. Revenue expanded by around 28.5% in FY23, followed by a significant 52.9% increase in FY24, reflecting accelerating commercial activity, improved customer acquisition, and higher demand for the company's products or services. Growth remained positive in FY25, with revenue rising 17.4% year-on-year, suggesting that the business continued to expand despite a more moderate growth rate. While the revenue trajectory is encouraging, the current scale of operations remains relatively small, suggesting that the company is still in its commercial expansion phase.
Despite robust revenue growth, operating profitability remains under pressure. EBITDA remained negative throughout the period, deteriorating from a loss of $5.21 million in FY22 to $7.54 million in FY25. EBITDA losses widened sharply in FY23 as the company accelerated investment in growth initiatives, before improving marginally in FY24. However, the EBITDA deficit increased again in FY25 despite higher revenue, suggesting that operating expenses—including employee costs, research and development, marketing, and administrative expenses—continued to outpace revenue growth. The persistence of negative EBITDA suggests that the company has not yet reached the operational scale necessary to generate positive cash earnings.
The net profit trend mirrors the EBITDA performance, with the company reporting losses in every financial year. Net losses expanded from $5.12 million in FY22 to $7.01 million in FY23, worsened further to $8.24 million in FY24, and improved modestly to $7.32 million in FY25. The slight reduction in FY25 losses indicates some improvement in cost management, financing costs, or non-operating items, although The business still be significantly unprofitable. Continued accounting losses imply that substantial investments are still being made to support future growth and commercialisation rather than maximizing near-term profitability.
From a liquidity perspective, The business still be exceptionally well positioned. The current ratio stood at a very strong 12.2x in FY22, moderated to 8.1x in FY23 and 4.1x in FY24 as working capital was utilized to fund expansion activities. However, liquidity strengthened substantially in FY25, with the current ratio rebounding to 13.0x, suggesting a significant increase in current assets relative to current liabilities, most likely following a successful capital raising or strengthened cash position. Such high liquidity provides the company with considerable financial flexibility to continue funding operations and strategic initiatives without immediate refinancing pressure.
The company's balance sheet remains conservatively leveraged, as reflected in the Total Liabilities-toTotal Assets ratio, which remained consistently low despite temporary increases. The ratio increased from 7.2% in FY22 to 11.4% in FY23, before rising to 21.8% in FY24, likely reflecting higher operating liabilities associated with business expansion. Importantly, leverage reduced significantly to 8.2% in FY25, showing balance sheet strengthening and suggesting that the company's asset base still be funded primarily through equity rather than debt. This low leverage profile significantly reduces financial risk and provides capacity for future funding if required.
Overall, the company's financial performance reflects a high-growth, early-stage business that is successfully expanding revenue but has yet to translate commercial momentum into sustainable profitability. While operating and net losses remain significant, the exceptionally strong liquidity position, low financial leverage, and consistent revenue growth indicate that the company possesses the financial capacity to continue investing in expansion. Going forward, achieving operating leverage through higher revenue scale, improving gross margins, and tighter cost control will be critical to narrowing losses and progressing toward long-term profitability.
Industry Overview
Favourable demand factors have supported demand for pharmaceutical products, including an ageing population and a greater incidence of chronic disease. Increased local and global demand for consumer healthcare products has also benefited several manufacturers. Even so, ongoing challenges have constrained revenue, including a changing regulatory and risk environment and reform-driven pricing pressures. Ongoing PBS reforms have heavily influenced manufacturers, as mandatory price disclosures and a greater reliance on generic drugs have continued to reduce prices and added to downwards pressures to profitability.
Australia's ageing population and expanding healthcare sector have underpinned demand for the Medical and Surgical Equipment Manufacturing industry. Sales surged in 2020-21, with revenue rising 31.6% owing to pandemic-induced demand for medical and surgical equipment like ventilators, infusion systems and renal care products used in intensive care units to treat the virus. While demand for these goods strengthened, restrictions on elective surgeries hit sales of other products like dental equipment and hearing aids. Industry revenue declined in 2022-23 and 2023-24 as sales softened following unusually high pandemic-era sales of ventilators and critical-care equipment. Prescribed List reforms from 1 July 2023 also lowered device prices in the private market, while hospital staffing shortages slowed clinical demand. Overall, after skyrocketing in the 2020-21 base year, industry revenue is anticipated to have fallen at an annualised 2.0% over the past five years to $7.1 billion in 2025-26, when revenue is anticipated to grow 2.1%.
Source: IBIS World
Risk Analysis
Prescient Therapeutics faces significant risks associated with the clinical development of its oncology pipeline, particularly the uncertainty surrounding the efficacy and safety outcomes of its lead cell therapy and targeted cancer programs. As a pre-revenue biotechnology company, it remains heavily dependent on external funding to finance research, clinical trials, and regulatory activities, exposing shareholders to potential capital dilution. Delays in patient recruitment, clinical trial execution, regulatory approvals, or unfavorable trial data could materially impact development timelines and investor confidence. The company also operates in a highly competitive oncology market, where larger pharmaceutical and biotechnology firms possess greater financial resources and commercialization capabilities. In addition, manufacturing complexities for cell therapies, intellectual property protection, and evolving regulatory requirements remain key operational and strategic risks.
Outlook
Prescient Therapeutics' outlook remains cautiously optimistic, underpinned by the advancement of its innovative precision oncology and cell therapy programs, including progress across clinical studies evaluating its lead candidates. Positive clinical data, successful expansion of trials, strategic collaborations, or licensing agreements could significantly enhance the company's valuation and funding prospects. Continued investment in proprietary technologies aimed at improving the safety and effectiveness of cancer therapies provides long-term growth potential. However, near-term performance will remain largely influenced by clinical milestones, regulatory progress, and the company's ability to secure sufficient capital without excessive shareholder dilution. If management still execute its development strategy successfully and delivers encouraging clinical outcomes, Prescient Therapeutics may be positioned to strengthen its standing within the emerging oncology therapeutics sector.
the original research publisher’sFoecast
For FY26, Prescient Therapeutics was expected to remain a clinical-stage biotechnology company with minimal operating revenue, as its valuation will continue to be driven primarily by clinical and regulatory progress rather than commercial product sales. The key focus during the year is likely to be the advancement of the Phase 2 PTX-100 trial in relapsed/refractory cutaneous T-cell lymphoma (CTCL), expansion of patient recruitment across international trial sites, and continued development of its cell therapy platform, OmniCAR. Positive interim clinical data, underpinned by the FDA Fast Track designation and European orphan drug status, could strengthen partnering opportunities and investor sentiment. Management has indicated that the company is adequately funded to achieve its next clinical milestones, although R&D expenditure was expected to remain elevated, resulting in another net loss during FY26, which is typical for an early-stage biotech. Overall, FY26 is forecast to be a milestone-driven year, with successful execution of clinical programs and maintenance of a healthy cash runway being the principal determinants of shareholder value rather than near-term revenue or profitability.
Technical Analysis
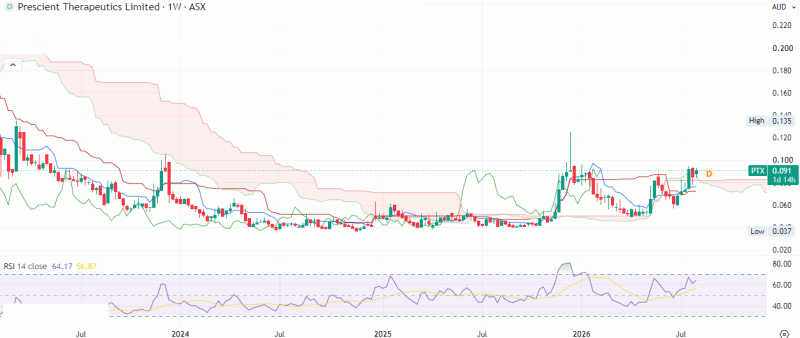
Source: TradingView
Historical Investment Assessment
Prescient Therapeutics presents a compelling long-term investment opportunity, influenced by its expanding precision oncology pipeline and innovative cell therapy platform. With multiple clinical programs advancing, regulatory support, and strategic collaborations, the company may be positioned to unlock significant value through positive trial outcomes and potential partnering opportunities. Although it was expected to remain lossmaking during its development phase, a strong cash position and clear clinical milestones provide confidence in execution. Successful delivery of upcoming catalysts could substantially enhance the company's valuation and establish a strong foundation for future commercial growth. Technically, the stock has developed a constructive bullish structure over the past few weeks, characterized by a consistent sequence of higher highs and higher lows, while forming a potential saucer pattern. The recent upside breakout from this formation signals improving demand and supports the possibility of sustained appreciation. The current consolidation provides a favorable entry opportunity for positional accumulation. Momentum indicators, including RSI and MACD, are trending upward, confirming strengthening momentum. The 50-day SMA still act as a crucial dynamic support. A decisive close below this average could trigger renewed selling pressure; otherwise, the medium-term bullish outlook remains intact. the original research recommended a “BUY” at current market around $0.091 (closing as on 5th August 2026) with stop loss of $0.060 and a target will be $0.150 for coming months.
This page adapts a historical research document and retains the original report date, company data and contemporaneous views. Market prices, financial information, forecasts, targets, stop-loss levels and recommendations may be outdated and have not been independently verified or updated by Sharesrise. References to research opinions are descriptions of the historical source, not newly issued Sharesrise recommendations.
This material is general information only and does not take account of any individual’s financial objectives, situation or needs. Securities, particularly smaller-capitalisation companies, involve substantial risk, including loss of capital. Past performance is not a reliable indicator of future performance. Seek appropriate professional advice and review current ASX announcements before making decisions. Sharesrise must obtain legal/compliance approval of this disclosure and the report rights before public release; this text does not assert an AFSL, CAR or other authorisation.