
RareX Limited is an emerging critical minerals explorer focused on rare earth elements and niobium hosted in hard rock carbonatite systems. The company is building a strategic portfolio of carbonatite-related prospects, with the Khaleesi Project serving as its flagship exploration asset. Located in the East Yilgarn region of Western Australia, Khaleesi is a district-scale, elevated-niobium and alkaline intrusive complex, illustrating strong geological potential. The project sits along strike from the Ponton Dyke, the Cundeelee carbonatite, and near the Tropicana Gold Mine, underscoring its placement within a prospective mineral corridor.
In parallel with exploration, RareX is advancing engineering and commercial initiatives at the mid-study level for the Cummins Range Project, a carbonatite-hosted rare earth and phosphate project. Cummins Range contains magnet-grade rare earths and battery-grade phosphates, positioning the company to benefit from rising demand linked to electrification and energy transition themes. The Khaleesi Project is also strategically located adjacent to the Mulga Rocks deposits, on the transition between the Yilgarn Craton and the Albany Fraser Belt within the Northern Foreland Unit, enhancing its long-term exploration upside.
Stock Overview — Key Metrics
Metric | Value |
|---|---|
Risk | Low to Medium |
Market Cap ($) | $25.47m |
Shares Outstanding | 1.21bn |
Beta | -0.1401 |
EPS (TTM) | -0.0043 |
P/E (TTM) | — |
Dividend Yield (%) | — |
52-Week Range ($) | $0.0075 – $0.049 |
Target Price ($) | $0.044 |
Stop Loss ($) | $0.012 |
Stock Performance Profile
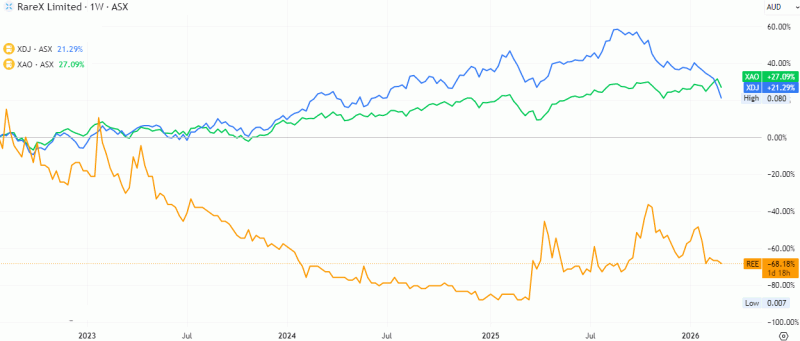
Source: TradingView
Financial Summary
Key Items | FY22 | FY23 | FY24 | FY25 |
|---|---|---|---|---|
Gross Profit ($m) | (1.498) | (1.304) | (1.463) | (1.625) |
EBITDA ($m) | (10.568) | (9.043) | (4.068) | (2.769) |
Financial Strength
Key Items | FY22 | FY23 | FY24 | FY25 |
|---|---|---|---|---|
Debt/Equity (%) | 3.4% | 4.4% | 0.2% | 0.2% |
Current Ratio | 4.3x | 2.4x | 2.1x | 2.8x |
Total Liabilities/Total Assets | 19.1% | 28.0% | 18.4% | 15.6% |
Source: Company filings and historical analysis
1. Profitability Analysis
Gross Profit Performance
The business recorded negative gross profit throughout FY22–FY25, suggesting that core operations are not yet generating sufficient revenue to cover direct operating or production costs. Gross loss widened from $(1.498) m in FY22 to $(1.625) m in FY25, despite a temporary improvement in FY23. The deterioration in FY24 and FY25 suggests continued pricing pressure, early-stage commercialization challenges, or high fixed production and development costs. Persistent negative gross margins indicate the business is still in a scaling or investment phase rather than a mature revenue-generating stage.
EBITDA Trend
EBITDA shows a significant improvement over the period, reducing losses from $(10.568) m in FY22 to $(2.769) m in FY25. This represents a strong operational turnaround driven likely by cost rationalization, improved operating efficiency, or tighter control over administrative and development expenses. The sharp improvement between FY23 and FY24 particularly signals management’s success in reducing cash burn. Although EBITDA remains negative, the trajectory suggests the company is moving closer to operational breakeven.
2. Operational Efficiency
The divergence between worsening gross profit and improving EBITDA implies that improvements are coming mainly from overhead cost reductions rather than revenue expansion. This suggests management has focused on restructuring expenses, optimizing staffing, or lowering discretionary spending. However, long-term sustainability will depend on improving gross margins through revenue growth, pricing power, or production efficiency rather than relying solely on cost cuts.
3. Financial Strength Analysis
Leverage Position (Debt/Equity)
The company maintains an extremely low leverage profile, with debt/equity declining sharply from 3.4% in FY22 to only 0.2% in FY24–FY25. This indicates minimal reliance on borrowings and a conservative capital structure. Such low leverage reduces financial risk and interest burden, which is particularly important for a loss-making company.
Liquidity Position (Current Ratio)
Liquidity remains strong across all years. The current ratio stayed well above 1x, ranging from 2.1x to 4.3x, showing the company’s ability to comfortably meet short-term obligations. Although liquidity weakened between FY22 and FY24, the recovery to 2.8x in FY25 signals improved working capital management or fresh capital inflows.
Balance Sheet Stability (Liabilities to Assets)
Total liabilities to total assets improved materially from 28.0% in FY23 to 15.6% in FY25, reflecting deleveraging and strengthening balance sheet quality. Lower liabilities enhance solvency and provide flexibility to fund future growth initiatives without significant financial strain.
4. Overall Financial Assessment
Overall, the company appears to be transitioning from a high-investment phase toward operational stabilization. While profitability remains negative at both gross and EBITDA levels, the consistent reduction in operating losses is a positive signal. The balance sheet is a major strength, characterized by low debt, improving solvency, and solid liquidity buffers, which reduce near-term financial risk.
However, the key challenge remains commercial scalability. Without improvement in gross profit margins, long-term profitability may remain difficult despite successful cost management.
5. Outlook
If the current trend continues, the company is likely to achieve further EBITDA improvement and potentially approach breakeven over the medium term. Future performance will depend primarily on revenue growth, margin expansion, and successful monetization of operations rather than additional expense reductions. Given its strong financial position and minimal leverage, the company has sufficient runway to execute its growth strategy, but sustained value creation will require a clear shift toward positive gross profitability.
Industry Overview
Australia's gold ore miners have performed well over the past few years thanks to skyrocketing gold prices, influenced by growing consumer demand for gold to hedge against inflation, economic uncertainty and geopolitical unrest. More recently, the US's sweeping tariffs have escalated trade tensions, causing uncertainty to loom over global economic growth prospects. This trend has rattled investors' confidence in riskier assets, propelling demand for safe-haven assets like gold in a "flight-to-safety". While investors also view U.S. Treasury bonds as a risk-free asset, the country's involvement in trade tensions has diminished its status as a safe-haven asset, contributing to the capital inflows from U.S. Treasury bonds to gold and lifting the commodity's price. Central banks have also actively purchased gold to diversify their reserve assets and bolster financial stability, supporting demand. Notably, the People's Bank of China diversified its asset base by selling US treasuries and aggressively purchasing gold, further spurring demand. The gold price climb in 2024-25 still underpin miners' optimism. Even so, production volumes haven't reflected the hike in demand, largely because of supply chain disruptions, high operation costs and unfavourable weather events. Labour shortages and high input costs intermittently hampered mining operations. AISCs have also risen as producers battle supply chain disruptions, climbing energy prices and labour shortages, limiting miners' profitability gains. Still, the elevated gold prices have stimulated miners' profitability expansion. Overall, gold ore mining revenue was expected to have increased at an annualised 5.7% over the five years through 2024-25, to $37.9 billion. This trend includes a 25.9% surge in 2024-25 thanks to the high gold prices.
Source: IBISWorld
Risk Analysis
RareX Limited faces elevated risk primarily due to its early-stage development profile and reliance on a single flagship asset, the Cummins Range rare earths and phosphate project in Western Australia. As a preproduction explorer, the company generates limited operating revenue and still report net losses, making it dependent on external capital raisings and funding facilities to advance development, which creates dilution and financing risk in volatile capital markets. Commodity price volatility is another key risk, as rare earth prices have historically been cyclical and sensitive to global demand, particularly from Chinadominated supply chains and EV/technology markets. Project execution risks also remain material, including metallurgy, infrastructure, permitting timelines, and cost inflation typical of remote mining developments. Although the recent granting of a mining lease reduces tenure risk, construction, funding, and offtake agreements must still be secured before production certainty improves. Additionally, expansion into international assets such as Mrima Hill introduces geopolitical and jurisdictional risks alongside execution complexity.
Outlook
RareX’s outlook is leveraged to growing global demand for critical minerals, particularly rare earths and gallium used in clean energy, defence, and semiconductor supply chains. The Cummins Range project — considered one of Australia’s largest undeveloped rare earth deposits — provides long-term strategic value and multi-commodity exposure through rare earths, phosphate, gallium, and scandium, potentially improving project economics if successfully developed. Recent milestones such as mining lease approval, ongoing metallurgical work, and financing arrangements indicate gradual de-risking and movement toward development decisions. Over the medium term, valuation upside depends on securing funding, offtake partners, and transitioning from explorer to producer, while supportive Western government policies aimed at diversifying rare earth supply outside China could act as a structural tailwind. However, until construction visibility and cash flow generation emerge, the company is likely to remain a high-risk, high-reward criticalminerals development story.
Historical Forecast and Assumptions
RareX Limited, an Australian critical-minerals explorer focused primarily on the Cummins Range rare earths, phosphate and gallium project, was expected to remain in a pre-production development phase through FY26, meaning revenues are likely to stay minimal while expenditure remains elevated. Following the recent granting of a mining lease and continued engineering, metallurgy and supply-chain planning, FY26 should represent a transition year toward project financing and staged development rather than commercial output. As a result, a reasonable FY26 financial forecast assumes revenue near A$0–2 million, mainly from minor activities or partnerships, with net losses in the range of A$4–7 million influenced by exploration, feasibility work and corporate costs, broadly consistent with historical cash burn typical of junior rare-earth developers. Cash flow was expected to remain negative, requiring periodic capital raises, while valuation and medium-term outlook depend heavily on rare earth price recovery and successful advancement of Cummins Range toward construction, positioning FY26 as a strategic investment and de-risking year rather than a profitability phase.
Technical Analysis
Historical Investment Assessment
RareX Limited remains a high-reward critical minerals developer, leveraged to rising global demand for rare earths and other strategic elements. The Cummins Range Project offers long-term optionality through multicommodity exposure, while recent approvals and ongoing technical progress signal gradual de-risking. However, FY26 was expected to remain a pre-production phase, with minimal revenue, continued cash burn, and reliance on external funding. Nearto medium-term upside depends on securing financing and offtake agreements, underpinned by Western policy initiatives aimed at diversifying supply chains away from China.
Technically, the stock has been consolidating within a narrow range over the past few weeks, and this phase may persist in the near term. The consolidation follows a recent upside breakout, offering a constructive setup for potential long positions at current levels. Momentum indicators such as RSI and MACD are gradually trending higher, suggesting strengthening bullish momentum. The 50-day simple moving average has consistently acted as strong support in recent sessions. A decisive close below this level could trigger incremental selling pressure; until then, the broader upside bias remains intact for the coming months. the original research recommended a “BUY” at current market around $0.021 (closing as on 4th March 2026) with stop loss of $0.012 and a target will be $0.044 for coming months.
This page adapts a historical research document and retains the original report date, company data and contemporaneous views. Market prices, financial information, forecasts, targets, stop-loss levels and recommendations may be outdated and have not been independently verified or updated by Sharesrise. References to research opinions are descriptions of the historical source, not newly issued Sharesrise recommendations.
This material is general information only and does not take account of any individual’s financial objectives, situation or needs. Securities, particularly smaller-capitalisation companies, involve substantial risk, including loss of capital. Past performance is not a reliable indicator of future performance. Seek appropriate professional advice and review current ASX announcements before making decisions. Sharesrise must obtain legal/compliance approval of this disclosure and the report rights before public release; this text does not assert an AFSL, CAR or other authorisation.