
SHAPE Australia Corporation Limited is an Australia-based national fitout and construction services specialist with capabilities spanning a broad range of sectors and project types. The Company delivers projects across commercial buildings, new-build and modular construction, facades, defence, education, healthcare, hospitality and retail. Its core capabilities include fitout and refurbishment, design and build, facade restoration, new-build construction, modular solutions, and aftercare and facilities maintenance. SHAPE provides end-to-end fitout and refurbishment services, ranging from high-end corporate office fitouts to boutique hotel projects, while its design-and-build offering provides clients with an integrated, turnkey solution from concept through completion.
The Company also specialises in new-build projects, including traditional construction as well as extensions and additions to existing buildings. Its modular construction solutions leverage the advantages of off-site manufacturing, including faster project delivery, improved safety, reduced disruption at project sites and more sustainable construction practices. In addition, SHAPE offers temporary and transportable building solutions designed to address changing space requirements across different industries. With its diversified capabilities and broad sector exposure, the Company is positioned to serve a wide range of construction and infrastructure requirements across Australia.
Stock Overview — Key Metrics
Metric | Value |
|---|---|
Risk | Low to Medium |
Market Cap ($) | $568.74m |
Shares Outstanding | 83.89m |
Beta | 0.2068 |
EPS (TTM) | 0.299 |
P/E (TTM) | 22.63 |
Dividend Yield (%) | 4.81% |
52-Week Range ($) | $3.91 – $7.96 |
Target Price ($) | $10.65 |
Stop Loss ($) | $4.65 |
Stock Performance Profile
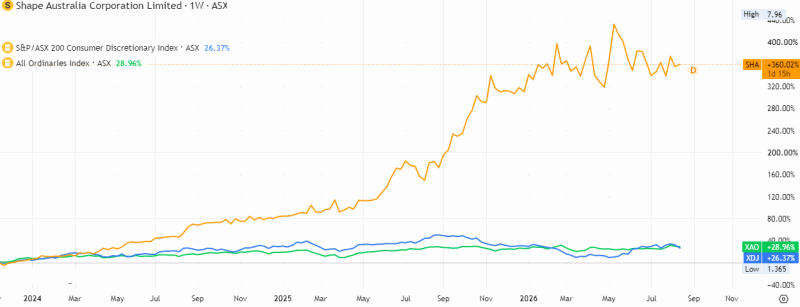
Source: TradingView
Financial Summary
Key Items | FY22 | FY23 | FY24 | FY25 |
|---|---|---|---|---|
Revenue ($m) | 658.3 | 862.4 | 839.0 | 956.9 |
EBITDA ($m) | 15.2 | 18.9 | 26.5 | 33.9 |
Net Income ($m) | 7.2 | 10.5 | 16.0 | 21.1 |
Financial Strength
Key Items | FY22 | FY23 | FY24 | FY25 |
|---|---|---|---|---|
Cash from Operations / Current Liabilities | 0.1x | 0.2x | 0.3x | 0.2x |
Debt / Capital (%) | 121.2% | 81.2% | 65.7% | 97.1% |
Long-Term Debt / Equity | 15.2x | 21.5x | 31.6x | 36.3x |
Source: Company filings and historical analysis
The company delivered a strong improvement in its operating and earnings performance between FY22 and FY25, although the balance sheet indicates a significant increase in financial leverage. Revenue increased from $658.3 million in FY22 to $956.9 million in FY25, representing an overall growth of approximately 45.4% and a compound annual growth rate of around 13.2%. Revenue expanded by 31.0% in FY23 to $862.4 million, before declining marginally by 2.7% to $839.0 million in FY24. The business subsequently returned to strong growth in FY25, with revenue rising 14.1% to $956.9 million. The FY25 performance is particularly encouraging as it not only reversed the FY24 contraction but also established a new revenue high for the four-year period. This suggests improving demand, stronger business activity and/or successful execution of the company's growth initiatives. Nevertheless, the uneven trajectory between FY23 and FY24 indicates that revenue remains exposed to fluctuations in market conditions, customer demand or project cycles.
EBITDA performance has improved materially over the period, showing strengthening operating profitability. EBITDA increased from $15.2 million in FY22 to $18.9 million in FY23, $26.5 million in FY24 and $33.9 million in FY25. This represents a gain of approximately 123% over three years and a CAGR of roughly 30%. Importantly, EBITDA growth has substantially outpaced revenue growth, suggesting a meaningful improvement in operating efficiency and margins. EBITDA margin increased from approximately 2.3% in FY22 to 2.2% in FY23, 3.2% in FY24 and 3.5% in FY25. Although the margin dipped slightly in FY23, the subsequent expansion is a positive indicator of improved cost management, operating leverage and potentially a more favourable revenue mix. The increase in EBITDA from $26.5 million to $33.9 million in FY25, despite revenue growing by 14.1%, further demonstrates that incremental revenue is being converted into earnings at an improved rate. However, the absolute EBITDA margin remains relatively modest, meaning that profitability could still be sensitive to increases in input costs, labour expenses, financing costs or weaker revenue conditions.
Net income has followed an even stronger upward trajectory. Net profit increased from $7.2 million in FY22 to $10.5 million in FY23, $16.0 million in FY24 and $21.1 million in FY25, representing growth of approximately 193% over the period and a CAGR of about 42.9%. Net profit increased by 45.8% in FY23, 52.4% in FY24 and a further 31.9% in FY25. This sustained earnings growth is considerably stronger than the underlying revenue expansion and points to improved operating leverage and profitability. Net profit margin rose from approximately 1.1% in FY22 to 1.2% in FY23, 1.9% in FY24 and 2.2% in FY25. The widening gap between revenue growth and net income growth is a particularly favourable development, suggesting that the company has become more effective at converting sales into bottom-line earnings. The FY25 net income of $21.1 million is almost three times the FY22 level, illustrating a substantial improvement in earnings capacity. Going forward, maintaining this trend will depend on the company's ability to sustain margin gains while managing its financing burden.
Financial Strength and Liquidity
The company's cash from operations relative to current liabilities improved from 0.1x in FY22 to 0.2x in FY23 and 0.3x in FY24, before moderating to 0.2x in FY25. The improvement through FY24 indicates that internally generated operating cash increasingly supported the company's short-term obligations. However, the decline to 0.2x in FY25 suggests that operating cash generation did not increase at the same pace as current liabilities. A ratio of 0.2x means operating cash flow covered only around one-fifth of current liabilities during FY25, suggesting that the company still rely on other liquidity sources, such as cash balances, working-capital management, financing facilities or refinancing, to meet short-term obligations. Therefore, despite the improvement in profitability, cash conversion remains an area that warrants close monitoring. Strong accounting earnings will be more sustainable if accompanied by consistently higher operating cash flows.
The Debt/Capital ratio presents the most significant financial risk in the company's capital structure. The ratio declined substantially from 121.2% in FY22 to 81.2% in FY23 and 65.7% in FY24, suggesting a considerable reduction in leverage during the first part of the period. However, this improvement reversed sharply in FY25, when the ratio increased to 97.1%. The FY25 level is substantially higher than FY23 and FY24 and indicates that debt represents a very significant component of the company's capital structure. The increase in leverage during FY25 is particularly important because it occurred alongside strong revenue and earnings growth, suggesting that part of the company's expansion or funding requirements may have been underpinned by additional debt. While leverage can enhance shareholder returns when operating earnings grow strongly, it also increases exposure to interest rates, refinancing conditions and any deterioration in operating performance. The sharp increase from 65.7% to 97.1% therefore represents a key financial risk.
The long-term debt-to-equity ratio has increased consistently and substantially, rising from 15.2x in FY22 to 21.5x in FY23, 31.6x in FY24 and 36.3x in FY25. This indicates an extremely high level of longterm debt relative to the company's equity base and represents a major balance-sheet vulnerability. Even though the company has generated strong EBITDA and net profit growth, the rapid expansion of long-term debt relative to equity means that shareholders have a comparatively thin equity cushion against financial or operating shocks. The rise to 36.3x in FY25 is particularly noteworthy and indicates that the company's capital structure has become increasingly debt-dependent. Such leverage can magnify returns when earnings are growing, but it can also magnify losses and place pressure on cash flows if earnings weaken or borrowing costs increase. Consequently, the sustainability of the company's growth strategy will depend heavily on its ability to generate sufficient operating cash flow to service and progressively manage its debt obligations.
Overall Assessment
Overall, the company demonstrated strong operational and earnings momentum from FY22 to FY25, with revenue rising at a healthy double-digit CAGR and EBITDA and net income growing substantially faster than revenue. The improvement in EBITDA margin from around 2.3% to 3.5% and net profit margin from approximately 1.1% to 2.2% indicates meaningful progress in operating efficiency and earnings conversion. FY25 was particularly strong, combining 14.1% revenue growth with 27.9% EBITDA growth and 31.9% net income growth. However, the improvement in profitability has been accompanied by a marked deterioration in financial leverage, with Debt/Capital increasing to 97.1% and long-term debt/equity reaching 36.3x. In addition, operating cash flow coverage of current liabilities remains relatively weak at 0.2x. Therefore, while the company's underlying operating performance is encouraging, its financial profile should be viewed with some caution. The key priorities should be maintaining revenue growth, protecting the recent margin expansion, strengthening cash conversion and reducing dependence on additional debt. If the company can sustain its earnings growth while improving operating cash generation and stabilising or reducing leverage, its financial position could strengthen considerably; conversely, weaker operating conditions combined with high leverage could materially increase financial risk.
Industry Overview
The performance of the Commercial and Industrial Building Construction industry depends on the fundamental drivers of the Australian economy, including growth in the labour force, the number of businesses and consumer spending. Favourable trends have driven the industry's robust performance over the past five years as the economy recovered from the COVID-19 pandemic. Despite the resurgence of demand for commercial and industrial building construction as Australians returned to workplaces and shopping malls, the structure of the commercial property market has changed with the greater tendency for employees to work and shop from home.
Wide fluctuations in revenue have characterised the Institutional Building Construction industry over the past five years, with revenue dipping to a low point in 2021-22 in response to the COVID-19 pandemic. The slump coincided with the completion of several large-scale developments, including the Victorian Heart Hospital at Monash University, the New Maitland Hospital in the Hunter Valley and the Victorian Quarantine Hub. The pandemic served as a catalyst for chaos in the aged-care sector, ultimately leading to a Royal Commission and severely eroding investment in aged-care facilities.
Source: IBISWorld
Risk Analysis
SHAPE Australia Corporation Limited (ASX: SHA) faces the typical risks associated with the construction and commercial fitout industry, including project execution delays, cost overruns, labour and subcontractor shortages, wage inflation, material-price volatility and competitive tendering pressure, all of which can compress already relatively modest construction margins. The company is also exposed to changes in economic conditions, particularly corporate capital expenditure and office refurbishment activity, although its diversification into education, industrial, data centres, healthcare, defence, retail and modular construction is reducing reliance on the traditional office-fitout market. Rapid growth and acquisitions, including Arden Group and Australian Professional Shopfitters, create additional integration and execution risks, while a larger project pipeline increases the potential financial impact of individual project underperformance. Nevertheless, SHAPE entered FY26 with a stronger operating base, and its FY25 results showed revenue rising 14.1% to $956.9 million, EBITDA increasing 26.3% to $32.7 million and NPAT increasing 31.9% to $21.1 million, suggesting improving profitability and operating discipline.
Outlook
The outlook for SHAPE remains positive, underpinned by strong project wins, increasing diversification and a substantial forward pipeline. In FY26, The business recorded particularly strong momentum outside traditional office fitouts, with education project wins increasing 170% to $153.5 million and industrial/datacentre wins reaching $137.4 million, compared with just $7.0 million in the corresponding prior period; aged-care wins also reached $57.5 million. Management's May 2026 trading update indicated project wins of more than $1.16 billion, expected FY26 revenue growth of almost 23%, and NPAT guidance of $30–32 million, while the forward pipeline was approximately $4.2 billion, offering substantial visibility into FY27. The acquisition-led expansion of retail fitout, maintenance and shopfitting capabilities should further broaden revenue sources and create cross-selling opportunities. Overall, SHAPE appears well positioned for continued revenue and earnings growth, with diversification into higher-growth sectors such as data centres, education, industrial and modular construction potentially supporting margin expansion; however, the key determinant of the outlook will be the company's ability to convert its large pipeline into profitable projects while maintaining disciplined risk management and avoiding cost overruns.
Historical Forecast and Assumptions
SHAPE Australia Corporation Limited was expected to deliver a strong FY26, underpinned by robust project wins, a materially higher backlog, diversification into education, industrial, data centres, healthcare and other non-office sectors, and the contribution from the Arden Group acquisition. Following 1HFY26 revenue of $553.3 million, up 15.5% year-on-year, EBITDA of $21.4 million, up 44.5%, and NPAT of $14.0 million, SHAPE has upgraded its FY26 outlook to revenue of approximately $1.175–$1.225 billion and NPAT of $30–$32 million, implying around 23% revenue growth and 42–52% NPAT growth over FY25. With backlog orders exceeding $680 million and project wins of more than $1.16 billion, revenue visibility remains strong, while the rapidly scaling Modular business and Arden’s higher-margin retail fitout and facilities-maintenance operations should support further margin expansion. Overall, FY26 is likely to represent another year of double-digit top-line growth and stronger earnings conversion, with NPAT around $31 million and EBITDA potentially in the $43–46 million range, although construction cost inflation, project execution risks and the pace of integration of acquisitions remain key variables.
Technical Analysis
Historical Investment Assessment
SHAPE Australia offers a compelling growth outlook, underpinned by strong project wins, a substantial forward pipeline and increasing diversification beyond traditional office fitouts. Expanding exposure to education, data centres, industrial, healthcare, modular construction and retail provide multiple avenues for sustained revenue growth and margin improvement. With FY26 earnings guidance upgraded and strong backlog visibility extending into FY27, the company appears well positioned for continued earnings momentum. Successful execution of its pipeline, disciplined cost control and effective integration of acquisitions could further strengthen profitability, making SHAPE an attractive growth story in Australia’s construction and fitout sector. Technically, the stock still exhibit a constructive bullish structure, consistently forming higher highs and higher lows across both daily and weekly timeframes, thereby sustaining the broader upward trajectory. A recent upside breakout from a flag formation, a classical bullish continuation pattern, signals renewed momentum and indicates scope for further appreciation in the near term. Momentum oscillators, including RSI and MACD, remain supportive, while Bollinger Bands and Ichimoku Cloud confirm strengthening price dynamics. The prevailing technical setup favors sustained upside, with intermittent declines likely to provide favorable accumulation opportunities. The broader trend remains firmly positive unless key support levels are decisively breached. the original research recommended a “BUY” in the stock at cmp $6.65 (as on 19th August 2026) with stop loss $4.65 and a target price of $10.65.
This page adapts a historical research document and retains the original report date, company data and contemporaneous views. Market prices, financial information, forecasts, targets, stop-loss levels and recommendations may be outdated and have not been independently verified or updated by Sharesrise. References to research opinions are descriptions of the historical source, not newly issued Sharesrise recommendations.
This material is general information only and does not take account of any individual’s financial objectives, situation or needs. Securities, particularly smaller-capitalisation companies, involve substantial risk, including loss of capital. Past performance is not a reliable indicator of future performance. Seek appropriate professional advice and review current ASX announcements before making decisions. Sharesrise must obtain legal/compliance approval of this disclosure and the report rights before public release; this text does not assert an AFSL, CAR or other authorisation.