
SKS Technologies Group Limited delivers advanced electrical technology solutions via creative design and installation of converged audio visual (AV) / information technology (IT), electrical and communication networking systems across Australia. The Company services business-to-business customers by offering integrated electrical technology packages to customers in any market sector. It also offers ongoing customer support services. Its services include audiovisual, communications, electrical, maintenance/essential services, energy management and smart building solutions. Its audiovisual services include display and projector systems, video and audio conferencing, touch panel control, public access systems, and specialist-controlled lighting. Its communication services include voice and data structured cabling, cable networking auditing, and patch panel management. Its energy management services include energy audits, energy monitoring, and energy savings timers and sensors.
Stock Overview — Key Metrics
Metric | Value |
|---|---|
Risk | Low to Medium |
Market Cap ($) | $906.81m |
Shares Outstanding | 115.37m |
Beta | 1.4392 |
EPS (TTM) | 0.233 |
P/E (TTM) | 33.71 |
Dividend Yield (%) | 1.24% |
52-Week Range ($) | $2.920 – $9.940 |
Target Price ($) | $13.25 |
Stop Loss ($) | $5.60 |
Stock Performance Profile:
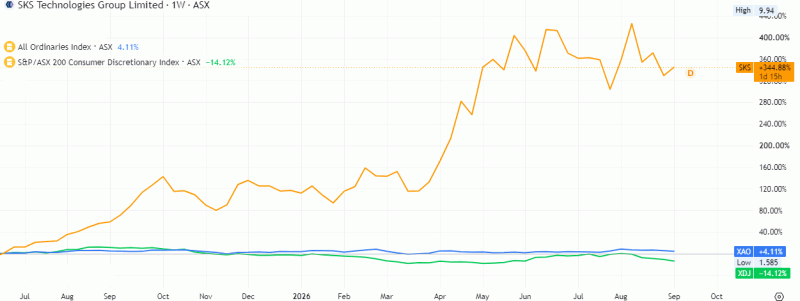
Source: TradingView
Financial Summary
Key Financial Highlights
Key Items | FY21 | FY22 | FY23 | FY24 |
|---|---|---|---|---|
Revenue ($m) | 83.3 | 136.3 | 261.7 | 347.9 |
EBITDA ($m) | 1.0 | 7.8 | 21.6 | 40.4 |
Net Income ($m) | 0.6 | 6.6 | 13.8 | 26.9 |
Financial Strength
Key Financial Ratios
Key Items | FY21 | FY22 | FY23 | FY24 |
|---|---|---|---|---|
Current Ratio | 1.0x | 1.1x | 1.2x | 1.1x |
Debt/Equity | 134.6% | 62.5% | 34.2% | 16.3% |
EBITDA / Interest | 2.3x | 14.9x | 35.0x | 71.9x |
Source: Company filings and historical analysis
The company demonstrated exceptionally strong financial and operational growth between FY21 and FY24, with substantial expansion in revenue, profitability and balance-sheet strength. Revenue increased from $83.3 million in FY21 to $347.9 million in FY24, representing an overall increase of approximately 318% and a compound annual growth rate (CAGR) of around 61%. Growth accelerated significantly during the period, with revenue rising by 63.6% in FY22, 92.0% in FY23, and a further 32.9% in FY24. Although the percentage growth rate moderated in FY24 due to the larger revenue base, the company continued to add substantial absolute revenue, illustrating sustained business momentum and increasing scale.
Profitability improved even more significantly than revenue growth. EBITDA increased from just $1.0 million in FY21 to $40.4 million in FY24, representing a dramatic improvement in operating earnings. The EBITDA margin expanded from approximately 1.2% in FY21 to 11.6% in FY24, showing that the company was able to convert its rapid revenue growth into substantially stronger operating profitability. EBITDA rose to $7.8 million in FY22, increased further to $21.6 million in FY23, and reached $40.4 million in FY24. This sustained improvement indicates increasing operating leverage, improved cost absorption and potentially greater efficiency as the business expanded.
The company's net income performance also showed a strong upward trajectory, increasing from $0.6 million in FY21 to $26.9 million in FY24. Net profit grew to $6.6 million in FY22, followed by $13.8 million in FY23, before nearly doubling to $26.9 million in FY24. Net profit margins improved significantly from approximately 0.7% in FY21 to 7.7% in FY24, reflecting a substantial strengthening in the company's ability to translate revenue into shareholder earnings. The consistent expansion in both EBITDA and net income suggests that profitability improvements were not merely influenced by accounting factors but were underpinned by stronger underlying operational performance.
From a liquidity perspective, the current ratio remained relatively stable, ranging between 1.0x and 1.2x throughout the period. The ratio improved from 1.0x in FY21 to 1.2x in FY23, before moderating slightly to 1.1x in FY24. While this indicates that the company maintained sufficient current assets to broadly cover its short-term liabilities, the liquidity position remains relatively tight compared with businesses holding substantial working-capital buffers. Nevertheless, the stability of the ratio, combined with significantly improving profitability and cash-generation potential, suggests that short-term financial management remained controlled during a period of rapid expansion.
A major improvement was evident in the company's capital structure and leverage profile. The debt-toequity ratio declined sharply from 134.6% in FY21 to just 16.3% in FY24. This represents a substantial deleveraging of the balance sheet and indicates that the company became progressively less dependent on debt financing. The ratio fell to 62.5% in FY22, declined further to 34.2% in FY23, and reached a conservative 16.3% in FY24. This improvement was likely underpinned by growing profitability, increased retained earnings and stronger equity accumulation. The significant reduction in leverage materially strengthens the company's financial flexibility and reduces its exposure to refinancing and interest-rate risks. The improvement in debt-servicing capacity was particularly impressive. The EBITDA-to-interest coverage ratio increased from 2.3x in FY21 to 71.9x in FY24. Interest coverage improved to 14.9x in FY22, increased further to 35.0x in FY23, and reached an exceptionally strong 71.9x in FY24. This substantial expansion demonstrates that the company's operating earnings increasingly exceeded its interest obligations by a significant margin. The improvement reflects the combined benefits of rapidly growing EBITDA and sharply declining financial leverage, substantially reducing financial risk.
Overall Assessment
Overall, the FY21–FY24 financial performance reflects a high-growth company undergoing a significant transformation in scale, profitability and financial strength. Revenue increased more than fourfold, while EBITDA and net income expanded at considerably faster rates, showing strong operating leverage and improving margins. At the same time, the company substantially strengthened its balance sheet by reducing its debt-to-equity ratio from a highly leveraged 134.6% to a conservative 16.3%, while interest coverage improved to an exceptionally comfortable 71.9x. The relatively stable current ratio of around 1.1x remains an area that warrants monitoring, particularly as the company still grow. However, the strong profitability trajectory, improving cash-generation potential and substantial deleveraging position the company with a significantly stronger financial foundation at the end of FY24. Overall, the financial trend indicates robust operational execution, improving earnings quality and materially reduced financial risk, offering a strong platform for future growth.
Industry Overview
Construction and industrial trends, and household spending, influence the installation and maintenance activities of the Electrical Services industry. Technological advancements in electrical, electronic and communications products are crucial for driving long-term demand for electrical services. Widely divergent trends in the core building and infrastructure markets have influenced the industry's performance over the five years through 2026-27, with revenue expected to expand at an annualised 2.0% to reach $40.5 billion. Revenue is anticipated to edge up marginally by 0.1% in the current year, as the scaling back of activity in the non-residential building market upon project completion offsets the expansion in electrical installation work in the residential building market. Profit margins have narrowed slightly as electrical contractors have faced intense competition in the residential building market and rising input prices.
Fierce competition from imports and softening demand from downstream markets have led to a dip in revenue for the Audio-Visual Electronic Equipment Manufacturing industry. Imports are high in the industry, having captured around three-quarters of domestic demand over the past five years. International companies have retained an advantage over domestic manufacturers by leveraging their low cost of production and strong brand reputation. Consistent import competition has prompted Australian manufacturers to differentiate themselves through quality and innovative technology. However, the expense of innovation investments, combined with the pressure to keep prices competitive, has contributed to a decline in profit margins in the industry.
Source: Mordor Intelligence
Risk Analysis
SKS Technologies Group faces several operational and execution risks as it continues its rapid expansion, particularly through its increasing exposure to large and complex data-centre projects. Key risks include project delays, cost overruns, shortages of skilled labour, supply-chain disruptions and increases in equipment and material costs, all of which could pressure project margins. The company's accelerated growth and national expansion also increase integration and management complexity, while competition for major infrastructure contracts remains significant. Cybersecurity represents another important operational risk given the company's growing digital infrastructure activities. In addition, a slowdown in data-centre investment or broader construction activity could affect future contract awards and revenue growth. However, SKS has implemented supplier commitments, cybersecurity measures, workforce development and diversified operations across multiple sectors to mitigate these risks.
Outlook
SKS Technologies Group enters the next phase with a stronger growth profile and improving earnings quality, underpinned by structural demand for data-centre infrastructure and increasingly complex electrical and technology projects. The FY26 outcome reinforces management’s execution capability, with revenue reaching approximately $347.9 million and NPAT exceeding earlier expectations at $27.1 million. The company’s expanding contracted pipeline provides solid revenue visibility, while its growing exposure to hyperscale and data-centre developments could support sustained demand over the medium term. Continued project wins, operational execution and scale benefits should support further margin expansion. Overall, SKS appears positioned to capitalise on the long-term digitisation and data-centre investment cycle, although project concentration and execution remain key factors to monitor.
the original research publisher Forecast
Going forward, SKS Technologies could deliver continued double-digit earnings growth if data-centre activity remains strong and the current order pipeline converts into revenue as expected. Following FY26 revenue of $347.9 million and NPAT of $27.1 million, a reasonable base-case outlook would be for revenue to move towards $390–410 million in FY27, with NPAT potentially reaching $30–33 million, assuming sustained project momentum and modest operating leverage. This would represent approximately 12–18% revenue growth and 11–22% NPAT growth. Further upside could emerge from larger data-centre contracts, stronger margins and improved utilisation. However, forecasts remain sensitive to project timing, labour availability, execution costs and the pace of data-centre capital expenditure.
Technical Analysis
Source: TradingView (as cited in the original report)
Historical Investment Assessment
SKS Technologies’ fundamentals remain strong, underpinned by solid data-centre demand, a growing contracted pipeline and proven earnings execution. FY26 results exceeded earlier NPAT expectations, illustrating improving operational performance and management’s ability to convert its project pipeline into profitable growth. The company may be positioned to benefit from continued investment in data centres, electrical infrastructure and digitalisation. With increasing scale, potential operating leverage and strong project visibility, earnings could continue to compound. Key risks include project execution, labour constraints, timing of contract wins and any slowdown in data-centre capital expenditure. Overall, the medium-term fundamental outlook remains positive. Technically, the stock still exhibit a robust bullish structure, marked by a sustained sequence of higher highs and higher lows within a well-defined ascending channel. After registering a fresh all-time high, the counter is undergoing healthy sideways consolidation, suggesting temporary profit booking rather than trend deterioration. Recent price action reflects persistent buying interest, with intermittent declines offering attractive accumulation opportunities. The stock has successfully rebounded from its 50-day Simple Moving Average, reaffirming strong dynamic support. Meanwhile, the rising trajectories of MACD and RSI confirm strengthening momentum, maintaining a constructive technical setup and supporting expectations of continued price appreciation over the medium term. the original research recommended a “Buy” at the closing price of $8.04 (as of 9th September 2026) with stop loss $5.60 for same target of $13.25.
This page adapts a historical research document and retains the original report date, company data and contemporaneous views. Market prices, financial information, forecasts, targets, stop-loss levels and recommendations may be outdated and have not been independently verified or updated by Sharesrise. References to research opinions are descriptions of the historical source, not newly issued Sharesrise recommendations.
This material is general information only and does not take account of any individual’s financial objectives, situation or needs. Securities, particularly smaller-capitalisation companies, involve substantial risk, including loss of capital. Past performance is not a reliable indicator of future performance. Seek appropriate professional advice and review current ASX announcements before making decisions. Sharesrise must obtain legal/compliance approval of this disclosure and the report rights before public release; this text does not assert an AFSL, CAR or other authorisation.