
Superloop Limited is an Australian telecommunications and internet service provider that delivers high-speed connectivity and digital infrastructure solutions across multiple segments. Its Consumer division focuses on offering reliable broadband internet and mobile services tailored for residential users, while continuously enhancing user experience through competitive pricing and network performance. The company leverages its own fibre network and strategic partnerships to ensure strong service delivery across urban and regional areas.
The Business and Wholesale segments form a key growth driver, offering a wide range of advanced solutions such as enterprise ethernet, SD-WAN, dark fibre, cloud security, managed WiFi, VoIP, and cybersecurity services. It also supports large-scale connectivity through NBN access, intercapital links, and international network capacity. In addition, Superloop provides specialized services like managed cyber security, hosted voice solutions, and network management platforms, positioning itself as an integrated digital infrastructure provider catering to enterprises, service providers, and institutional clients.
Stock Overview — Key Metrics
Metric | Value |
|---|---|
Risk | Medium to High |
Market Cap ($) | $1.60bn |
Shares Outstanding | 514.71m |
Beta | 1.2376 |
EPS (TTM) | 0.0263 |
P/E (TTM) | 118.48 |
Dividend Yield (%) | — |
52-Week Range ($) | $1.90 – $3.57 |
Target Price ($) | $5.50 |
Stop Loss ($) | $2.40 |
Stock Performance Profile
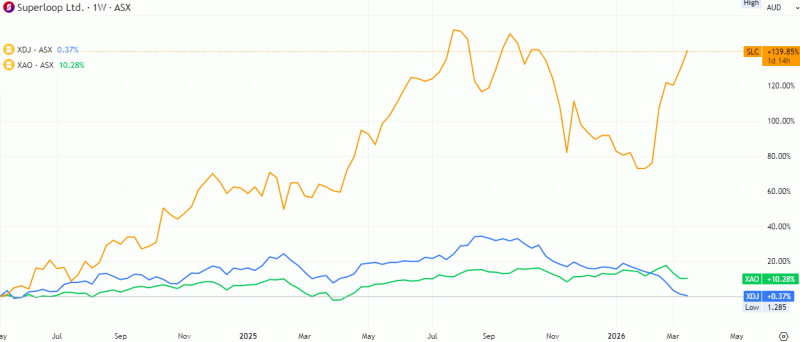
Source: TradingView
Financial Summary
Key Items | FY22 | FY23 | FY24 | FY25 |
|---|---|---|---|---|
Revenue ($m) | 248.2 | 322.2 | 416.6 | 546.5 |
EBITDA ($m) | 17.5 | 16.0 | 30.5 | 64.5 |
Net Income ($m) | (52.6) | (43.2) | (14.7) | 1.2 |
Key Financial Ratios
Key Items | FY22 | FY23 | FY24 | FY25 |
|---|---|---|---|---|
Current Ratio | 0.5x | 0.9x | 1.0x | 1.1x |
Debt/Equity | 15.5% | 16.4% | 14.0% | 20.7% |
EBITDA / Interest | 4.1x | 5.9x | 13.3x | 14.6x |
Financial Analysis (FY22–FY25)
The business has shown strong revenue growth over the four-year period, with revenue increasing from $248.2m in FY22 to $546.5m in FY25, representing more than 120% cumulative growth. This consistent expansion suggests strong demand for the company’s products or services and indicates that the business has been successful in scaling operations. Revenue growth accelerated particularly between FY24 and FY25, when sales rose by nearly 31%, illustrating improving market penetration and possibly stronger operational execution.
Profitability has improved significantly during the period, particularly at the EBITDA level. EBITDA
declined slightly from $17.5m in FY22 to $16.0m in FY23, likely due to rising operating costs or investment in growth initiatives. However, profitability rebounded strongly afterward, reaching $30.5m in FY24 and $64.5m in FY25. This sharp improvement suggests that the company has begun to benefit from operating leverage, where revenue growth is translating into disproportionately higher earnings as fixed costs are spread over a larger revenue base.
The company has also made notable progress toward net profitability. Net losses narrowed significantly from -$52.6m in FY22 to -$14.7m in FY24, before the company finally recorded a small net profit of $1.2m in FY25. This transition from persistent losses to profitability indicates improved cost management, stronger margins, and potentially reduced non-operating expenses. Although the profit level remains modest relative to revenue, the trend suggests the business is entering a break-even and potentially sustainable profit phase.
From a financial strength perspective, liquidity has steadily improved. The current ratio increased from 0.5x in FY22 to 1.1x in FY25, suggesting that the company has strengthened its short-term financial position and is now better equipped to meet its short-term obligations. While a ratio above 1.0 generally indicates adequate liquidity, the earlier low ratios suggest that the company previously operated with tight working capital but has since improved its balance sheet management.
Leverage remains relatively moderate but has increased slightly in FY25. The debt-to-equity ratio declined from 16.4% in FY23 to 14.0% in FY24, reflecting a period of balance sheet strengthening. However, it rose to 20.7% in FY25, which may indicate additional borrowing to support expansion. Despite this increase, the level of leverage remains manageable and not excessively high compared with many growth-oriented companies.
Importantly, the company’s ability to service its debt has improved significantly. The EBITDA-tointerest coverage ratio rose from 4.1x in FY22 to 14.6x in FY25, showing a substantial improvement in financial resilience. This indicates that operating earnings now cover interest expenses comfortably, reducing financial risk and suggesting that the company’s growing profitability is strengthening its capacity to manage debt obligations.
Overall, the financial performance shows a clear turnaround trajectory, characterized by rapid revenue growth, improving profitability, strengthening liquidity, and strong interest coverage. While net profits remain relatively small compared with revenue, the company appears to be transitioning from a growthand-investment phase to a more stable and profitable operating phase, which could support stronger earnings over the years ahead if current trends continue.
Industry Overview
The Computer System Design Services industry has expanded considerably in recent years, as many client businesses have outsourced non-essential systems operations and computers and IT systems have required regular upgrades and enhancements. Greater IT adoption has fuelled growth and financial services providers, including banks and insurers, have remained the most significant clients. Widespread reliance on the internet has underpinned computer system design services’ expansion. To extend their reach, some computer system design firms have merged services with other consulting firms, including strategic planning and business research companies. The industry often overlaps with management consulting, as both industries increasingly offer broad start-to-finish service models. This overlap means larger firms are entering the industry through mergers and acquisitions.
Source: IBIS World
Risk Analysis
Superloop Limited faces several risks associated with the highly competitive Australian telecommunications and broadband market. Intense competition from larger providers such as Telstra, TPG Telecom, and Optus may pressure pricing and margins, particularly in the retail NBN segment. The company’s growth strategy relies on expanding its customer base and wholesale partnerships, which requires continuous investment in network infrastructure and technology upgrades, potentially increasing capital expenditure and leverage. In addition, regulatory changes in Australia’s broadband sector and reliance on the NBN Co network could affect wholesale costs and profitability. Operational risks such as customer churn, integration challenges from acquisitions, and rapid technological changes in connectivity services may also impact performance.
Outlook
Superloop Limited is well-positioned to benefit from the rising demand for high-speed broadband, cloud connectivity, and enterprise-grade networking solutions across Australia. Increasing adoption of NBN services, along with growing digitalization among businesses, was expected to drive sustained demand across its Consumer, Business, and Wholesale segments. The company’s expanding fibre infrastructure and improving network capacity further strengthen its ability to deliver reliable, high-performance services.
Additionally, Superloop’s focus on strategic partnerships, customer acquisition, and value-added services such as cybersecurity and managed networks enhances its competitive positioning. As the company still scale its operations and optimize costs, it is likely to gain market share in both residential and enterprise segments. This positions Superloop for steady medium-term growth, underpinned by strong industry tailwinds and increasing reliance on digital infrastructure.
Historical Forecast and Assumptions
Superloop Limited was expected to deliver strong financial performance in FY26, underpinned by robust customer growth and expanding broadband market share. The company’s HY26 revenue growth of over 23% reflects solid momentum across key segments, with a growing subscriber base exceeding 800,000 users. With management targeting a revenue run-rate of around A$700 million, the company is on track to achieve fullyear revenue in the range of A$650–700 million.
Profitability is also expected to improve as operating leverage kicks in, with EBITDA guidance of A$109–117 million suggesting margin expansion. Continued investments in fibre networks, smart-community projects, and enterprise solutions are likely to sustain growth, although competitive pressures in the NBN market may moderate the pace. Overall, Superloop appears set for consistent earnings growth and stronger financial stability in the near to medium term.
Technical Analysis
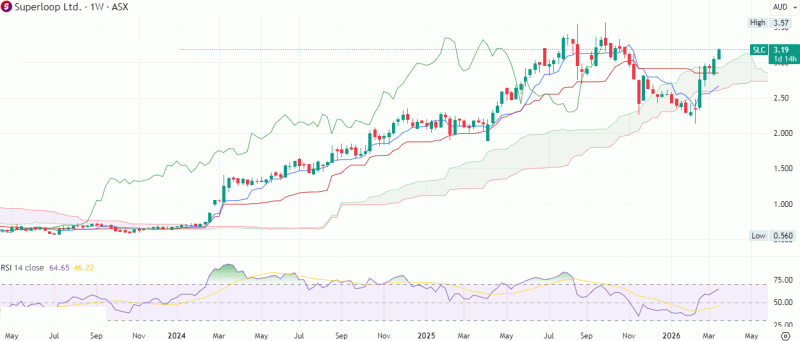
Source: TradingView
Historical Investment Assessment
Superloop Limited shows strong fundamentals underpinned by steady revenue growth, an expanding customer base, and improving operating leverage. Growth across its Consumer, Business, and Wholesale segments, along with continued investment in fibre infrastructure, positions the company to benefit from rising demand for high-speed connectivity and digital services. Profitability was expected to improve with scale and cost control, although competitive pressure in the NBN market remains a key risk. Overall, The business provides a positive long-term growth outlook with strengthening financial performance. Technically, the stock maintains a bullish trend, having reached its all-time high a few months ago, followed by healthy profitbooking and a recovery toward previous peak levels. The price still move within an ascending channel, suggesting sustained upward momentum. The 50-day SMA is acting as strong support, while RSI and MACD are trending higher and nearing overbought levels, reflecting strong buying interest and potential for further upside in the near to medium term. the original research recommended a “BUY” at current market around $3.19 (as on 18th March 2026) keeping stop loss of $2.40 for a target price of $5.50.
This page adapts a historical research document and retains the original report date, company data and contemporaneous views. Market prices, financial information, forecasts, targets, stop-loss levels and recommendations may be outdated and have not been independently verified or updated by Sharesrise. References to research opinions are descriptions of the historical source, not newly issued Sharesrise recommendations.
This material is general information only and does not take account of any individual’s financial objectives, situation or needs. Securities, particularly smaller-capitalisation companies, involve substantial risk, including loss of capital. Past performance is not a reliable indicator of future performance. Seek appropriate professional advice and review current ASX announcements before making decisions. Sharesrise must obtain legal/compliance approval of this disclosure and the report rights before public release; this text does not assert an AFSL, CAR or other authorisation.