
Talga Group Ltd is an Australia-based battery materials and technology company. The Company is engaged in the development of sustainable battery materials via technology and vertical integration of its 100% owned Swedish graphite resources. The business provides a supply of products for the green transition. Its flagship product, Talnode-C, is a natural graphite anode material made using renewable energy for a low emissions footprint. Its battery materials under development include an advanced silicon anode product and conductive additives for cathodes. It is also advancing and the commercialization of its silicon anode, Talnode-Si. It owns 100% of multiple mineral assets of graphite (Cg), copper (Cu), cobalt (Co) and iron (Fe) in northern Sweden. Its projects include Vittangi Graphite Project, Jalkunen Graphite Project, Kiskama Copper-Cobalt Project, Raitajarvi Graphite Project, Vittangi Iron Project and Masugnsbyn Iron Project.
Stock Overview — Key Metrics
Metric | Value |
|---|---|
Risk | Low to Medium |
Market Cap ($) | $137.95m |
Shares Outstanding | 510.93m |
Beta | 1.7619 |
EPS (TTM) | -0.0558 |
P/E (TTM) | — |
Dividend Yield (%) | — |
52-Week Range ($) | $0.190 – $0.565 |
Target Price ($) | $0.440 |
Stop Loss ($) | $0.185 |
Stock Performance Profile
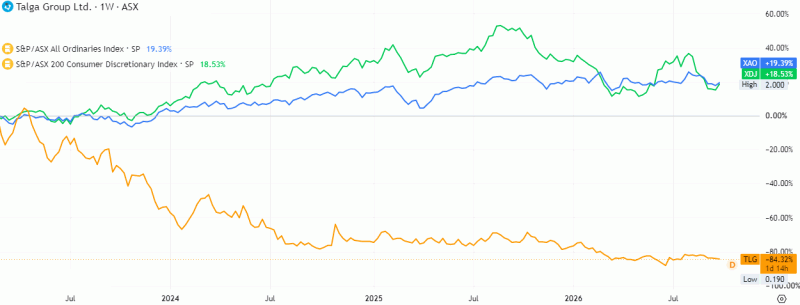
Source: TradingView
Financial Summary
Key Financial Highlights
Key Items | FY22 | FY23 | FY24 | FY25E |
|---|---|---|---|---|
Revenue ($m) | 0.280 | 0.225 | 0.106 | 1.85 |
EBITDA ($m) | (36.164) | (34.229) | (13.588) | (21.86) |
Net Income ($m) | (43.356) | (38.257) | (16.728) | (30.17) |
Financial Strength
Key Financial Ratios
Key Items | FY21 | FY22 | FY23 | FY24 |
|---|---|---|---|---|
Current Ratio | 6.3x | 3.2x | 3.3x | 1.8x |
Debt/Equity | 4.2% | 3.6% | 2.4% | 1.5% |
Total Liabilities/Total Assets | 12.5% | 12.7% | 10.2% | 26.4% |
Source: Company filings and historical analysis
The financial profile reflects a very early-stage, loss-making business with limited operating revenue and a relatively strong balance-sheet position, although the LTM FY25 figures indicate a meaningful deterioration in financial stability compared with FY24.
Revenue Performance
Revenue remained extremely small and declined from $0.280 million in FY22 to $0.225 million in FY23 and $0.106 million in FY24, representing a cumulative decline of approximately 62% over the two-year period. This indicates that the business had very limited commercial activity or was still primarily focused on development rather than generating recurring operating revenue. The LTM FY25 revenue of $1.85 million represents a substantial improvement, increasing by more than 17 times from FY24. This sharp increase is an important positive development and suggests that the company may have begun converting its development activities into commercial or project-related revenue. However, because the LTM figure is substantially higher than the historical base, it should be interpreted cautiously until the higher revenue level is demonstrated consistently over several reporting periods.
EBITDA Performance
EBITDA remained deeply negative throughout the period, although there was a significant improvement in FY24. EBITDA losses narrowed from $36.164 million in FY22 to $34.229 million in FY23 and further to $13.588 million in FY24, suggesting a substantial reduction in operating cash-cost pressure. Nevertheless, the LTM FY25 EBITDA loss widened to $21.86 million, despite the considerable increase in revenue. This suggests that the recent revenue growth has not yet translated into operating profitability and that expenditure has increased alongside business activity. The LTM EBITDA margin is approximately -1,182%, compared with an FY24 margin of approximately -12,819%, so there has actually been a major improvement in operating leverage relative to the extremely low FY24 revenue base. However, the absolute EBITDA loss remains significant and demonstrates that the company still require substantial funding before achieving sustainable operating profitability.
Net Income Performance
Net losses followed a similar pattern to EBITDA. The company recorded a $43.356 million net loss in FY22 , followed by a $38.257 million loss in FY23 and a materially lower $16.728 million loss in FY24. The reduction in losses through FY24 indicates progress in controlling operating and other expenses. However, the LTM FY25 net loss increased again to $30.17 million, signalling renewed cost pressure and continued dependence on external funding or balance-sheet resources. The LTM net loss is considerably larger than the FY24 loss despite the strong increase in revenue, suggesting that the company has not yet reached the scale necessary to absorb its cost base. Overall, earnings remain highly negative and profitability should therefore be regarded as a longer-term objective rather than an established characteristic of the business.
Current Ratio and Short-Term Liquidity The current ratio declined from 6.3x in FY22 to 3.2x in FY23 and 3.3x in FY24, before falling further to 1.8x in LTM FY25. Although this represents a substantial deterioration from FY22, a ratio of 1.8x still indicates that current assets are approximately 1.8 times current liabilities. On the face of the supplied figures, the company therefore retains a reasonable short-term liquidity buffer. However, the direction of movement is important: the reduction from 3.3x to 1.8x in the latest period suggests that liquidity has become less comfortable, potentially reflecting increased working-capital requirements, cash utilisation, or growthrelated expenditure. Given the continuing operating and net losses, maintaining adequate liquidity will remain an important financial consideration.
Debt-to-Equity
The company's debt position appears very conservative. Debt-to-equity declined consistently from 4.2% in FY22 to 3.6% in FY23, 2.4% in FY24 and just 1.5% in LTM FY25. This represents a substantial reduction in financial leverage and indicates that the company has not relied heavily on conventional debt financing to fund its activities. Low debt exposure reduces interest-rate and refinancing risk and provides greater flexibility than would be available to a highly leveraged development-stage company. However, the low debt ratio should not be interpreted as evidence of financial sustainability, because the company still generate significant operating and net losses. Its principal financial challenge appears to be funding ongoing losses and development expenditure rather than servicing a large debt burden.
Total Liabilities-to-Total Assets
Total liabilities represented 12.5% of assets in FY22, 12.7% in FY23 and 10.2% in FY24, showing a relatively low level of balance-sheet leverage. However, the ratio increased sharply to 26.4% in LTM FY25. The latest level remains moderate in absolute terms, but the increase of more than 16 percentage points from FY24 indicates a significant change in the balance-sheet structure. This could reflect an increase in liabilities associated with expansion, operating commitments, creditors, provisions or other obligations. The combination of a higher liabilities-to-assets ratio and a lower current ratio suggests that the balance sheet has become less conservative than it was in FY24.
Overall Financial Position
Overall, The business still be financially developmental rather than commercially mature. The most encouraging feature is the substantial increase in LTM FY25 revenue, accompanied by a much better revenue-to-EBITDA relationship than in FY24. At the same time, the company still report a large EBITDA loss and substantial net loss, showing that the recent revenue expansion has not yet produced sustainable profitability. Balance-sheet leverage remains low, with debt-to-equity falling to only 1.5%, which limits traditional debt-related financial risk. However, liquidity has weakened considerably, with the current ratio falling to 1.8x, while total liabilities relative to assets have more than doubled from FY24 to 26.4%. Consequently, the key financial priorities are likely to be sustaining the recent revenue growth, controlling operating expenditure, reducing cash burn, preserving liquidity and progressing toward positive EBITDA and net income. The trajectory of revenue and cash requirements over the next few reporting periods will be particularly important in determining whether the sharp LTM FY25 revenue improvement represents the beginning of a sustainable commercial scale-up or a temporary increase in activity.
Risk Analysis
Talga Group Ltd’s key risks remain concentrated around project financing, construction execution, commercial scale-up and funding requirements as it advances the Vittangi Anode Project in Sweden. Although the company has secured the major permits for the Nunasvaara South graphite mine and has progressed FEED for the initial 5,000 tpa development, the project still requires a successful Final Investment Decision and sufficient funding before large-scale construction can proceed. Talga has identified a potential ~A$260 millionEIB debt facility and ~A$120 million EU Innovation Fund grant, but these are subject to conditions and do not eliminate financing risk. The business still be exposed to construction-cost inflation, delays, commissioning and ramp-up risks, while its current operating revenue is still small relative to the capital required for commercial-scale production. Customer qualification and offtake execution also remain important, with the July 2026 Hanwa arrangement being a non-binding LOI, meaning definitive offtake and investment agreements are yet to be completed. Additional risks include volatility in graphite prices, competition from established Chinese producers, fluctuations in the AUD/SEK/EUR currencies, environmental and community considerations, and potential future equity funding that could dilute existing shareholders. Talga also faces the broader technology risk that battery manufacturers could increasingly adopt alternative anode technologies, although its current strategy is increasingly focused on premium, highperformance applications rather than commodity graphite markets.
Outlook
Talga’s outlook is increasingly linked to the successful commercialisation of its vertically integrated Swedish natural-graphite-to-anode supply chain, with the company targeting an initial staged 5,000 tpa development before further expansion. The project has progressed materially, with the mine’s environmental permit, exploitation concession and detailed plan in force, while FEED work has advanced toward completion and the company is targeting an FID in early 2027. The strategic rationale is underpinned by growing efforts in Europe and Japan to diversify critical-mineral supply chains away from China, while Talga reports increasing demand for its Talnode® products across battery storage, robotics, defence, drones and other highperformance applications. The July 2026 Hanwa LOI could potentially strengthen both the customer and financing pathway if it converts into binding agreements, while existing European funding support provides an additional potential source of project capital. In AUD terms, the principal investment driver is therefore likely to be the company’s ability to convert its substantial project potential into funded construction, binding offtake contracts and ultimately commercial production; successful execution could materially improve revenue visibility and reduce dependence on capital markets, whereas delays in financing, FID, construction or customer qualification could prolong cash burn and increase dilution risk. Overall, the medium-term outlook is closely tied to the 2026–27 financing and FID milestones rather than current operating earnings.
Historical Forecast and Assumptions
Talga Group Ltd (ASX: TLG) is forecast to remain in the development and investment phase in FY26, with revenue estimated at approximately A$1–3 million, reflecting limited commercial sales while the Vittangi Anode Project advances toward final investment decision and full-scale production; operating expenses, project development costs and exploration expenditure were expected to keep EBITDA around -A$20 to - A$25 million and net loss around A$25–35 million, although the outcome will depend heavily on project timing, funding requirements and capitalised development expenditure. The company’s FY25 strategy highlighted progress toward FID, customer offtake agreements and project financing, while its vertically integrated graphite-to-anode model remains the principal long-term growth driver. FY26 should therefore be viewed primarily as a project-development and financing year rather than a meaningful revenuegeneration year, with cash preservation, financing for Vittangi, customer qualification and construction readiness likely to remain the key financial priorities.
Technical Analysis
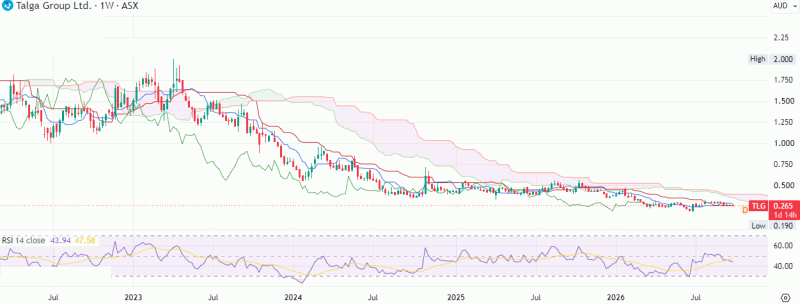
Source: TradingView
Historical Investment Assessment
Talga enters FY26 with a strong long-term growth opportunity as it advances its vertically integrated Swedish graphite-to-anode business toward commercialisation. While near-term earnings were expected to remain subdued during the development phase, progress on FEED, permitting, customer qualification, financing and the targeted FID in early 2027 provides multiple potential catalysts. Growing demand for nonChinese critical-mineral supply chains and Talnode® applications further strengthens the strategic opportunity. If Talga successfully secures project funding, binding offtake agreements and moves into construction, the company could transition toward significantly greater revenue visibility and substantial long-term value creation. Technically, the stock has been consolidating following a sharp corrective phase and has gradually regained strength over recent months, forming a bullish rounding-bottom pattern that reflects sustained accumulation and improving investor participation. The long-term price structure also indicates the formation of a potential double-bottom pattern, a classic bullish reversal setup that could trigger renewed upside momentum in the coming months. The Ichimoku Cloud still reinforce the constructive trend structure, while momentum indicators, including RSI and MACD, have generated fresh bullish signals. Improving momentum, underpinned by strengthening price action, enhances the probability of a sustained medium-term uptrend and further appreciation. the original research recommended a “BUY” in the stock at cmp $0.265 (at closing rates of 30th September 2026) with stop loss $0.185 and a target price of $0.440.
This page adapts a historical research document and retains the original report date, company data and contemporaneous views. Market prices, financial information, forecasts, targets, stop-loss levels and recommendations may be outdated and have not been independently verified or updated by Sharesrise. References to research opinions are descriptions of the historical source, not newly issued Sharesrise recommendations.
This material is general information only and does not take account of any individual’s financial objectives, situation or needs. Securities, particularly smaller-capitalisation companies, involve substantial risk, including loss of capital. Past performance is not a reliable indicator of future performance. Seek appropriate professional advice and review current ASX announcements before making decisions. Sharesrise must obtain legal/compliance approval of this disclosure and the report rights before public release; this text does not assert an AFSL, CAR or other authorisation.