
Titomic Limited is an Australian advanced manufacturing company that develops integrated solutions for industrial-scale metal additive manufacturing using its patented Cold Spray Additive Manufacturing (Cold Spray AM) technology. Unlike traditional metal 3D printing methods that rely on high temperatures, Titomic’s cold spray process bonds metal particles at supersonic speeds without melting them, enabling the production, repair, and coating of high-performance metal components. The company serves a broad range of industries, including aerospace, defence, shipbuilding, oil and gas, mining, automotive, and industrial manufacturing, where lightweight, durable, and corrosion-resistant components are in high demand.
The business conducts operations through three geographic segments: Australia, the United States, and Europe. Its Australian operations focus on manufacturing high-pressure, large-scale Cold Spray AM systems and producing components for aerospace and defence customers. In the United States, Titomic concentrates on sales, business development, and customer engagement to expand its presence in key aerospace and defence markets. Its European operations specialise in lowand medium-pressure cold spray systems designed for metal coating, repair, and restoration applications. By combining proprietary technology, equipment manufacturing, engineering services, and research and development capabilities, Titomic aims to strengthen its position as a global provider of advanced additive manufacturing and industrial repair solutions.
Particulars | Value |
|---|---|
Risk | Low to Medium |
Market Cap ($) | 337.58m |
Shares Outstanding | 1.61bn |
Beta | 1.1685 |
EPS (TTM) | -0.024 |
PE (TTM) | - |
Dividend Yield (%) | - |
52 Week Range ($) | 0.180 – 0.360 |
Target Price ($) | 0.330 |
Stop Loss ($) | 0.140 |
Stock Performance Profile
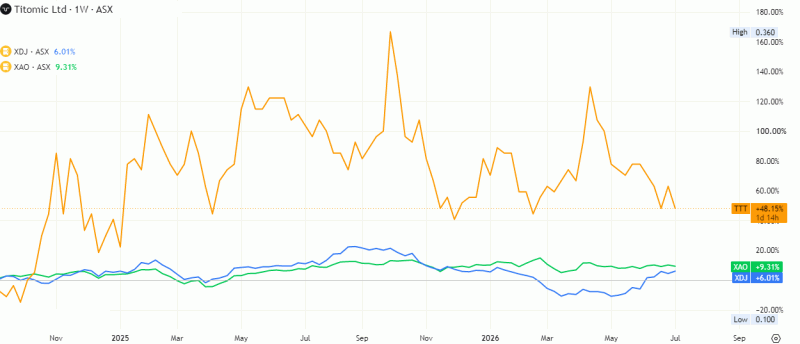
Source: TradingView
Financial Summary
Key Items | FY22 | FY23 | FY24 | FY25 |
|---|---|---|---|---|
Revenue ($m) | 5.321 | 4.488 | 7.697 | 9.427 |
EBITDA ($m) | (14.479) | (11.281) | (10.924) | (19.583) |
Net Income ($m) | (16.972) | (15.709) | (11.892) | (19.887) |
Financial Strength
Key Items | FY22 | FY23 | FY24 | FY25 |
|---|---|---|---|---|
Debt/Equity | 19.2% | NM | 108.2% | 82.3% |
Current Ratio | 2.3x | 1.2x | 1.5x | 2.0x |
Total Liabilities/Total Assets | 50.0% | 111.3% | 87.2% | 57.8% |
Source: Company filings and historical analysis
The company recorded a volatile but overall improving revenue trajectory during FY22–FY25, with revenue increasing from US$5.32 million in FY22 to US$9.43 million in FY25, representing a compound annual growth rate (CAGR) of approximately 21% despite a decline in FY23. Revenue fell by 15.7% in FY23 to US$4.49 million, reflecting operational or project-related disruptions. However, the company rebounded strongly in FY24 with revenue rising 71.5% to US$7.70 million, followed by a further 22.5% increase in FY25 to US$9.43 million. While the sustained recovery demonstrates improving commercial activity, the revenue base remains relatively modest, suggesting that the business is still in its growth or development phase.
Despite revenue growth, profitability remained under significant pressure throughout the period. EBITDA remained negative in all four years, improving from a loss of US$14.48 million in FY22 to US$10.92 million in FY24, before deteriorating sharply to US$19.58 million in FY25. The EBITDA margin remained deeply negative, exceeding -200% in every year, suggesting that operating expenses continued to substantially outweigh revenues. The sharp increase in EBITDA losses during FY25 indicates higher exploration, development, administrative or expansion-related expenditure that outpaced revenue growth. Consequently, the company has yet to achieve operational leverage despite increasing sales.
Net income followed a similar pattern, with losses narrowing from US$16.97 million in FY22 to US$11.89 million in FY24, reflecting improved operating performance and cost control during that period. However, FY25 witnessed a significant setback as the net loss widened to US$19.89 million, the highest in the fouryear period. This reversal indicates that additional operating costs, depreciation, financing expenses or oneoff charges more than offset revenue gains. Overall, The business still be firmly in an investment and expansion phase, prioritizing growth over near-term profitability.
From a balance sheet perspective, leverage fluctuated considerably across the period. The Debt-to-Equity ratio stood at a conservative 19.2% in FY22, but became not meaningful (NM) in FY23, likely due to negative shareholder equity resulting from accumulated losses. The ratio subsequently increased sharply to 108.2% in FY24, suggesting debt exceeding shareholders' equity, before improving to 82.3% in FY25 as equity strengthened or debt levels moderated. Although leverage remains relatively high, the improvement in FY25 suggests progress toward restoring capital structure stability.
Liquidity remained generally adequate throughout the period. The Current Ratio declined from a healthy 2.3x in FY22 to 1.2x in FY23, reflecting tighter short-term liquidity amid operational challenges. However, the ratio improved to 1.5x in FY24 and further strengthened to 2.0x in FY25, suggesting a comfortable ability to meet short-term obligations. The recovery in working capital suggests improved cash management, capital raising activities or stronger current asset balances, offering greater financial flexibility despite ongoing operating losses.
The company's asset quality also improved over time. Total Liabilities as a percentage of Total Assets increased significantly from 50.0% in FY22 to 111.3% in FY23, implying liabilities temporarily exceeded total assets and illustrating a period of considerable financial stress. This ratio improved substantially to 87.2% in FY24 and further to 57.8% in FY25, suggesting strengthening asset coverage and a healthier balance sheet. The declining liability burden suggests successful capital injections, asset growth or debt restructuring efforts, reducing solvency risk compared to FY23.
Overall, the financial performance presents a mixed picture. The company has successfully expanded its revenue base and materially improved its liquidity and balance sheet following the stressed conditions experienced in FY23. However, persistent and widening operating losses, particularly in FY25, demonstrate that the business has yet to convert revenue growth into sustainable profitability. Going forward, the key determinants of financial improvement will be the company's ability to scale revenues while controlling operating costs, reduce cash burn, strengthen margins and continue improving its capital structure.
Industry Overview
The industry is highly fragmented due to the diverse nature of the products, with many firms producing low quantities of specialised products. Downstream markets, like mining and manufacturing, strongly influence the industry's performance. Industry revenue was expected to grow at an annualised 3.3% over the five years through 2025-26 to $2.8 billion. This includes an expected 2.1% decline in the current year due to slow growth in downstream demand stemming from a sharp rise in interest rates.A strong performance in the industry's major market, mining, has contributed to revenue growth over the past five years. Rising capital expenditure by the private sector has supported manufacturers. Imports from manufacturers in nations like China have accounted for a high proportion of domestic demand.
They are driving out local producers relying on low domestic production costs to remain profitable. Foreign manufacturing hubs typically have low labour costs and specialise in manufacturing high-quantity, standardised products. Despite rampant import competition, industry enterprise and establishments numbers have risen as domestic manufacturers dominate niche markets, creating bespoke, high-quality products.Industry revenue is forecast to fall at annualised 0.7% over the five years through 2028-29 to $2.7 billion. Mixed demand conditions in key downstream industries, like manufacturing, will likely limit revenue growth. Actual capital expenditure on mining is set to grow over the next five years, which is set to support industry growth. An anticipated appreciation of the Australian dollar over the next five years will likely reduce domestic product competitiveness, constraining export revenue. However, a continued shift towards high-value specialised manufacturing is likely to offset this decline and support an increase in profitability over the period. Import competition is slated to continue threatening industry players as developed countries continue to innovate and produce products on par with domestic manufacturers. This trend is anticipated to be an additional barrier for domestic manufacturers who have pivoted to creating high-value products.
Trends and Insights
Strong performance from downstream mining firms has driven industry revenue growth over the past five years. Despite the demand for mining falling in the current year, capital expenditure for mining has continued to grow, further supporting industry revenue. Domestic manufacturers in the industrial machinery industry face strong competition from low-cost imports, leading to a decline in their market share. To compete, they focus on producing high-quality, niche products for export to advanced economies. Industrial machinery manufacturers are predominantly located in New South Wales, Victoria, and Queensland. This is due to these states' abundant labour supply and skilled workforce. Australian industrial machinery manufacturers face intense competition from international trade. This is due to the drastic advantages imports have over domestic manufacturers, as they operate with lower overhead costs
Source: IBISWorld
Risk Analysis
Titomic Limited operates in the emerging metal additive manufacturing and cold spray technology market, exposing it to significant commercialization and execution risks. The business still be reliant on successfully converting pilot programs and demonstrations into long-term commercial contracts, particularly in the defence, aerospace, energy, and industrial sectors. Revenue concentration in government and defence projects creates exposure to procurement delays, budget changes, export regulations, and geopolitical factors. Additional risks include technology qualification and certification, product quality and warranty liabilities, dependence on key personnel, supply chain disruptions, cyber security threats, foreign exchange fluctuations across its global operations, and the potential need for additional capital before achieving sustainable positive cash flow, which could dilute existing shareholders. As an early-stage growth company, failure to scale manufacturing efficiently or secure recurring revenue streams could materially impact its financial performance.
Outlook
Titomic's outlook is underpinned by growing global demand for advanced manufacturing technologies, particularly in defence, aerospace, and maintenance, repair, and overhaul (MRO) markets. The company has strengthened its strategic position through expansion in the United States, increasing engagement with Tier-1 defence contractors, and pursuing government-supported funding opportunities while shifting toward highermargin service and recurring revenue models. Management has outlined an ambitious long-term growth strategy targeting substantial revenue expansion through commercial deployment of its proprietary cold spray technology. However, achieving these objectives will depend on consistent contract wins, successful technology commercialization, production scale-up, and disciplined cost management. While we expect the company to move toward profitability over the medium term, execution remains the primary determinant of whether Titomic can translate its technological leadership into sustainable earnings growth.
Historical Forecast and Assumptions
For FY26, Titomic Limited was expected to deliver another year of strong revenue growth, underpinned by increasing commercialisation of its cold spray additive manufacturing technology, higher defence and aerospace contracts, and expanding partnerships across Europe, the US, and Australia. Revenue is forecast to rise by approximately 40–60% year-on-year as the company converts its growing order pipeline into sales, while gross margins were expected to improve through greater manufacturing scale and higher-value system sales. However, Titomic is likely to remain in a modest net loss position during FY26 as it continues investing in research and development, global sales expansion, and production capabilities. Cash flow was expected to improve with stronger customer receipts and milestone payments, reducing reliance on external capital. Overall, FY26 is anticipated to be a pivotal year, with accelerating commercial adoption and operational leverage positioning the company closer to sustainable profitability in the medium term.
Technical Analysis
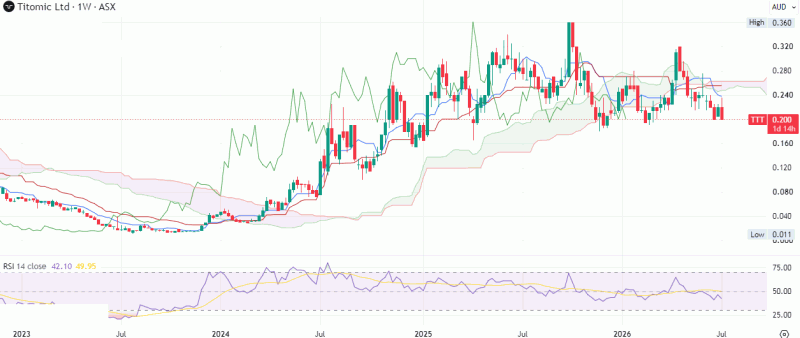
Source: TradingView
Historical Investment Assessment
Titomic is well positioned for long-term growth, underpinned by rising demand for advanced manufacturing solutions in defence, aerospace, and industrial markets. Its expanding global footprint, growing commercial pipeline, and proprietary cold spray technology provide a strong foundation for accelerating revenue and improving margins. While continued investment may keep near-term profitability constrained, increasing contract wins, production scale, and recurring revenue opportunities were expected to strengthen financial performance. If management executes successfully on its commercialization strategy, Titomic has the scope to transition toward sustainable profitability and create meaningful long-term shareholder value. Technically, the stock still exhibit a well-defined pattern of higher highs and higher lows on the weekly charts, confirming a sustained primary uptrend. Since last year, price action has remained firmly bullish, with the recent consolidation appearing to be a healthy pause within the broader upward trajectory. Trading within a rising channel further reinforces the positive market structure and underlying strength. Momentum indicators, including the RSI, MACD, and Bollinger Bands, continue to support the prevailing bullish bias, suggesting scope for further upside. Any short-term corrective decline should be viewed as a strategic accumulation opportunity within the ongoing uptrend. the original research recommended a “BUY” in the stock at cmp $0.200 (at closing rates of 8th July 2026) with stop loss $0.140 and a target price of $0.330.
This page adapts a historical research document and retains the original report date, company data and contemporaneous views. Market prices, financial information, forecasts, targets, stop-loss levels and recommendations may be outdated and have not been independently verified or updated by Sharesrise. References to research opinions are descriptions of the historical source, not newly issued Sharesrise recommendations.
This material is general information only and does not take account of any individual’s financial objectives, situation or needs. Securities, particularly smaller-capitalisation companies, involve substantial risk, including loss of capital. Past performance is not a reliable indicator of future performance. Seek appropriate professional advice and review current ASX announcements before making decisions. Sharesrise must obtain legal/compliance approval of this disclosure and the report rights before public release; this text does not assert an AFSL, CAR or other authorisation.