
Urbanise.com Limited is an Australia-based provider of cloud-based Software as a Service (SaaS)platform for property management, specifically strata and facilities management. Its segments include Strata and Facilities Management. It specializes in delivering cutting-edge proptech solutions through its two platforms: Urbanise Strata and Urbanise FM. The Strata platform manages the communications and accounting functions for apartment buildings, strata commercial towers and large housing communities. The Facilities Management platform manages the repair and maintenance of infrastructure, buildings, residential and commercial properties. Urbanise Strata serves strata managers in administering strata schemes and jointly owned properties. Urbanise FM software aids facilities managers in property asset maintenance and contractor supervision. Its client base spans across 17 countries with over 600,000 lots managed on Urbanise Strata and 2.2 million assets managed on Urbanise FM.
Particulars | Value |
|---|---|
Risk | Low to Medium |
Market Cap ($) | 51.29m |
Shares Outstanding | 78.91m |
Beta | 0.2444 |
EPS (TTM) | -0.0328 |
PE (TTM) | - |
Dividend Yield (%) | - |
52 Week Range ($) | 0.607 – 0.890 |
Target Price ($) | 1.050 |
Stop Loss ($) | 0.455 |
Stock Performance Profile
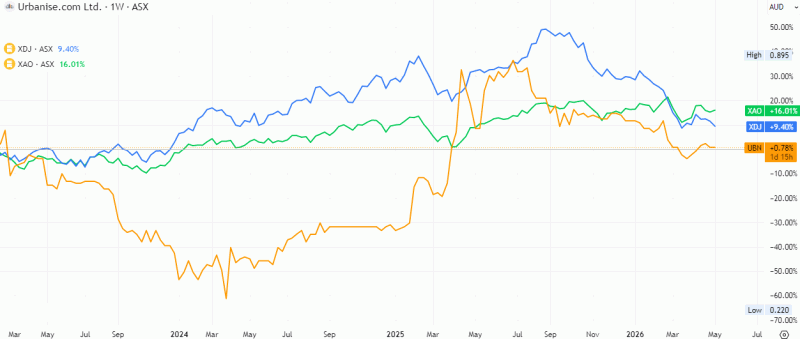
Source: TradingView
Financial Summary
Key Items | FY22 | FY23 | FY24 | FY25 |
|---|---|---|---|---|
Revenue ($m) | 12.665 | 12.850 | 12.604 | 13.129 |
EBITDA ($m) | (3.939) | (4.883) | (2.517) | (3.741) |
Net Income ($m) | (5.896) | (5.665) | (3.464) | (3.591) |
Financial Strength
Key Items | FY22 | FY23 | FY24 | FY25 |
|---|---|---|---|---|
Current Ratio | 1.0x | 0.8x | 1.6x | 1.8x |
Total Asset Turnover | 0.8x | 0.8x | 0.7x | 0.8x |
Total Liabilities/Total Assets | 52.0% | 63.1% | 47.1% | 41.0% |
Source: Company filings and historical analysis
The financial performance over FY22–FY25 reflects a company that is stable at the top line but still struggle with profitability, while showing gradual improvement in balance sheet strength and liquidity.
Revenue has remained largely flat across the four-year period, moving from $12.67 million in FY22 to $13.13 million in FY25. This represents a modest cumulative growth of roughly 3.7%, suggesting limited expansion and possibly a mature or constrained operating environment. The dip in FY24 to $12.60 million suggests some volatility or external pressure, but the recovery in FY25 indicates resilience. However, the lack of strong revenue growth signals challenges in scaling operations or capturing additional market share.
Profitability remains a key concern. EBITDA has been consistently negative throughout the period, worsening from -$3.94 million in FY22 to -$4.88 million in FY23, before improving to -$2.52 million in FY24 and then declining again to -$3.74 million in FY25. This trend indicates ongoing operational inefficiencies and highcost structures. While FY24 showed signs of cost control or operational improvement, the reversal in FY25 suggests that these gains were not sustainable. EBITDA margins remain deeply negative, pointing to structural issues in the business model.
Net income follows a similar trajectory, remaining negative across all years. Losses narrowed from -$5.90 million in FY22 to -$3.46 million in FY24, suggesting some improvement in bottom-line performance, likely influenced by cost rationalization or non-operating factors. However, the slight increase in losses to -$3.59 million in FY25 reflects persistent challenges in achieving profitability. The gap between EBITDA and net income also suggests the presence of significant depreciation, interest, or other non-operating expenses.
From a financial strength perspective, there is a notable improvement. The current ratio increased from 1.0x in FY22 to 1.8x in FY25, suggesting enhanced liquidity and a stronger ability to meet short-term obligations. The dip to 0.8x in FY23 highlighted a temporary liquidity stress, but the subsequent recovery suggests improved working capital management or capital infusion.
Efficiency, as measured by total asset turnover, has remained relatively stable between 0.7x and 0.8x. This indicates that the company is generating consistent revenue per unit of assets, but without meaningful improvement. It reflects a steady but unoptimized use of assets, with no significant gains in operational efficiency.
Leverage has improved significantly over the period. The total liabilities-to-total assets ratio declined from 63.1% in FY23 to 41.0% in FY25. This reduction indicates deleveraging and a stronger equity base, which enhances financial stability and reduces risk. The improvement suggests either repayment of debt, equity infusion, or a combination of both.
Overall, while the company has made progress in strengthening its balance sheet and liquidity position, its core challenge remains profitability. Stable revenues combined with persistent operating losses indicate that strategic focus should be directed toward cost optimization, pricing power, and operational efficiency. Without addressing these structural issues, long-term sustainability and value creation may remain constrained.
Industry Overview
The rapid expansion of websites, digitisation across the economy and the growth of ecommerce have substantially boosted demand for cloud hosting and data processing services, fuelling industry revenue growth. Active Australian domain names rose 27.3% between November 2023 and November 2024, reflecting this momentum. The shift to remote work and digital operations, accelerated by the pandemic, has driven businesses to outsource data storage and IT infrastructure, favouring scalable and cost-efficient cloud solutions. Companies that have realised the benefits of large-scale data analysis, which allows them to derive valuable insights from consumer data, have presented a growing source of downstream demand. The industry is also benefiting from rapid adoption of AI platforms, as cloud computing services are used to process responses from large language models. Overall, revenue for the Cloud Hosting and Data Processing Services industry was expected to climb at an annualised 8.1% over the five years through 2025-26 to reach $3.9 billion, including an anticipated jump of 10.6% in 2025-26.
Trends and Insights
Rising website creation and digitisation have been driving robust revenue growth in the industry. Companies are expanding their online presence, boosting demand for cloud hosting and data processing services, as shown by a surge in active domain registrations. Financial services, insurance and government clients increasingly drive demand for cloud hosting and data processing. Banks and insurers require secure, scalable solutions but also develop in-house capability, while public sector organisations have rapidly expanded their online and remote digital services. Economic activity along Australia’s eastern seaboard attracts many cloud hosting and data processing companies. Sydney contains the head offices of many of the nation's financial institutes, whereas Melbourne houses a bustling technology sector. Clients seeking cost-competitive solutions can benefit from turning to overseas providers, which have advantages in exchange rates and lower overhead costs. Domestic companies, meanwhile, are focusing on exceptional customer service and tailored offerings to remain competitive.
Source: IBIS World
Risk Analysis
Urbanise.com faces a combination of structural and execution risks typical of early-stage SaaS businesses transitioning toward scale. The most prominent risk is persistent lack of profitability, with negative EBITDA and net margins suggesting that revenue growth has not yet translated into sustainable earnings, raising concerns about long-term operating viability. Additionally, low gross margins relative to SaaS peers suggest cost inefficiencies or limited pricing power, which may hinder margin expansion even as revenue grows. The company also exhibits customer concentration and churn risk, as ARR growth has been partly offset by customer losses, illustrating retention challenges. Further, ongoing investments—particularly in product development, AI integration, and the National Australia Bank partnership—are driving short-term cash flow pressure, with the business remaining operating cash flow negative in FY26. While the balance sheet is currently strong with low debt and reasonable cash reserves, reliance on upfront customer payments and working capital movements for cash generation introduces cash flow sustainability risk if growth slows.
Outlook
Urbanise.com’s outlook is cautiously positive, underpinned by its growing recurring revenue base and expanding ARR, which rose to $13.2m with continued pipeline conversion and new customer wins. The strategic partnership with National Australia Bank and the development of integrated payments and data services provide a potential step-change in product capability and monetisation, positioning the company to capture a larger share of the strata and facilities management software market. Furthermore, ongoing investment in AI-driven automation and its cloud-native platform enhances product differentiation and longterm scalability. Management expects a return to positive operating cash flow by FY2027, suggesting a pathway toward financial stability as scale improves. However, the outlook remains dependent on successful execution of growth initiatives, margin improvement, and customer retention, making the next 12–24 months critical in validating its transition from a growth-phase SaaS company to a profitable, scalable platform business.
Historical Forecast and Assumptions
Urbanise.com Ltd was expected to deliver moderate top-line growth in FY26, underpinned by expansion in recurring SaaS revenues, new customer wins, and its strategic banking integration initiatives. Based on H1 FY26 performance (revenue of ~$7.3m, up ~15% YoY) and company guidance, full-year FY26 revenue is projected to reach approximately A$14.5–16.0 million (around 10–15% growth), with Annualised Recurring Revenue continuing to expand on the back of contract wins and backlog conversion. EBITDA losses were expected to narrow due to operating leverage and cost discipline, though the company will likely remain marginally loss-making at the net level as it continues investing in product development and partnerships. Cash reserves (~A$12–13m) and negligible debt provide balance sheet stability, while operating cash flow may stay slightly negative in FY26 before turning positive in FY27. Overall, FY26 should reflect a transition year with improving margins, stronger recurring revenue visibility, and gradual progress toward profitability.
Technical Analysis
Historical Investment Assessment
Urbanise.com Ltd presents a cautiously optimistic outlook, influenced by steady growth in recurring SaaS revenue and expanding ARR, underpinned by new client wins and strategic initiatives such as its partnership with National Australia Bank. Continued investment in AI-led automation and its cloud-native platform enhances differentiation and scalability. While FY26 was expected to be a transition year with moderate revenue growth and narrowing losses, improving operating leverage and a robust financial position provide stability. The key inflection point lies in execution over the next 12–24 months, with successful scaling and customer retention critical to achieving sustainable profitability by FY27. From a technical perspective, the stock shows a constructive trend on the broader timeframe, recently forming a higher high on weekly charts. A flag formation suggests a bullish continuation pattern. After a sharp decline last year, the stock is showing signs of a strong recovery, suggesting underlying strength may persist. It has broken above the prior swing high and is holding above the Ichimoku Cloud, reinforcing bullish sentiment. With momentum indicators approaching oversold territory, a near-term rebound appears likely, offering a potential opportunity for selective accumulation. Hence, the original research recommended a “Buy” in $0.650 (closing as on 6th May 2026) with stop loss $0.455 and a target price of $1.050 for coming few months.
This page adapts a historical research document and retains the original report date, company data and contemporaneous views. Market prices, financial information, forecasts, targets, stop-loss levels and recommendations may be outdated and have not been independently verified or updated by Sharesrise. References to research opinions are descriptions of the historical source, not newly issued Sharesrise recommendations.
This material is general information only and does not take account of any individual’s financial objectives, situation or needs. Securities, particularly smaller-capitalisation companies, involve substantial risk, including loss of capital. Past performance is not a reliable indicator of future performance. Seek appropriate professional advice and review current ASX announcements before making decisions. Sharesrise must obtain legal/compliance approval of this disclosure and the report rights before public release; this text does not assert an AFSL, CAR or other authorisation.