
Wisr Limited is an Australia-based neo-lender focused on delivering technology-enabled consumer finance solutions. The company provides unsecured personal loans and secured vehicle loans with maturities of three, five, and seven years, primarily to Australian consumers. These loans are funded through structured warehouse funding arrangements, allowing Wisr to scale its lending operations while managing balance sheet risk. Its loan portfolio includes debt consolidation, car loans, medical loans, and other personal finance products designed to offer flexible and transparent borrowing options.
Beyond lending, Wisr operates a Financial Wellness Platform centered around the Wisr App, which integrates credit, education, and money-management tools. The platform offers multiple credit score comparison services, debt-reduction features, and Wisr Today, Australia’s first money-coaching app. Through data-driven insights, educational content, and technology-led products such as credit scores and round-up tools, Wisr aims to improve financial outcomes for borrowers while creating long-term value for investors and promoting healthier financial habits among everyday Australians.
Particulars | Value |
|---|---|
Risk | Low to Medium |
Market Cap ($) | 54.51m |
Shares Outstanding | 1.76bn |
Beta | 3.0936 |
EPS (TTM) | -0.0052 |
PE (TTM) | - |
Dividend Yield (%) | - |
52 Week Range ($) | 0.024 – 0.042 |
Target Price ($) | 0.060 |
Stop Loss ($) | 0.018 |
Stock Performance Profile
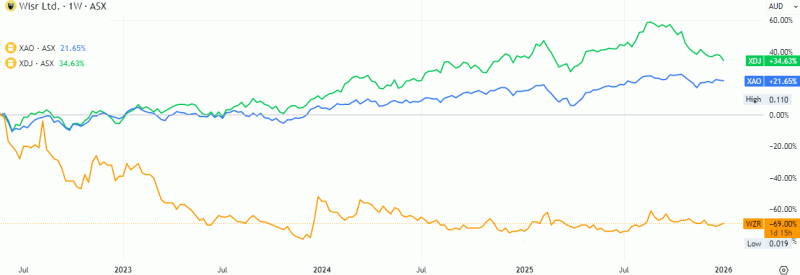
Source: TradingView
Financial Summary
Key Items | FY22 | FY23 | FY24 | FY25 |
|---|---|---|---|---|
Revenue ($m) | 24.286 | 23.381 | 21.934 | 25.799 |
Net Income ($m) | (19.905) | (13.154) | (8.191) | (7.260) |
Financial Strength
Key Items | FY22 | FY23 | FY24 | FY25 |
|---|---|---|---|---|
Current Ratio | 104.3x | 185.9x | 170.8x | 86.4x |
Debt/Capital | 91.0% | 93.2% | 94.3% | 96.9% |
Source: Company filings and historical analysis
1. Revenue Trend & Growth
Revenue shows meaningful volatility and an overall declining trend before a rebound in FY25:
Financial Year | Revenue Performance | Change (%) |
|---|---|---|
FY22 – FY23 | Revenue Declined | -3.7% |
FY23 – FY24 | Revenue Declined | -6.2% |
FY24 – FY25 | Revenue Recovered | +17.6% |
Interpretation
The two-year revenue contraction (FY22–FY24) suggests challenges such as weaker demand, pricing pressure, loss of customers, or operational constraints. The sharp rebound in FY25 signals recovery—possibly influenced by improved market activity, stronger sales execution, or new business wins. Despite the FY25 uplift, revenue remains relatively modest, suggesting the company is still in a smallcap or early-stage operational phase.
2. Profitability & Net Income
Net income remains consistently negative, though losses are narrowing over time:
Losses improved significantly between FY22 and FY24. FY25 shows only a modest improvement vs FY24, despite revenue rebounding strongly.
Interpretation
The continuous losses indicate structural unprofitability, but the trend toward lower losses suggests improving cost control or operational leverage. The limited improvement in FY25 despite higher revenue implies: High fixed costs Margin compression Or increased investment spending offsetting revenue gains Break-even is not yet in sight, and the business is still reliant on funding to sustain operations.
3. Financial Strength & Liquidity
Current Ratio ?Interpretation
These values are extraordinarily high—far beyond normal operating ranges. This almost certainly indicates: A very low level of current liabilities, or Large holdings of cash or near-cash assets, often seen in early-stage or capital-raising companies. A decline to 86.4x in FY25, while still extremely strong, suggests: Liquidity position has reduced Possibly due to cash burn funding losses Or an increase in current liabilities
Bottom line:The company appears to have substantial liquidity buffers, and short-term solvency risk is minimal—at least historically. Monitoring the declining trend is important.
4. Capital Structure & Leverage
Debt to Capital
Interpretation
The company is highly leveraged, with debt accounting for over 90% of the capital base in every year, rising steadily. This means: Equity is very thin or negative The company is financially risky from a capital perspective Debt providers bear substantial exposure
Trend Risk
The continuous rise to 96.9% in FY25 signals growing dependence on debt funding and shrinking equity cushion. Combined with ongoing losses, this increases balance-sheet fragility and potential refinancing risk.
Overall Assessment
Positive Indicators
Revenue recovery in FY25 is encouraging. Losses are narrowing over time. Liquidity remains extremely strong, reducing short-term cash risk.
Key Red Flags
Business remains structurally loss-making. Debt dependency is extreme and rising, with very limited equity protection. Liquidity is trending downward—if losses continue, this cushion will erode. Financial sustainability depends on: Continued access to funding Achieving meaningful, consistent profitability
Outlook Considerations To strengthen financial health, the company likely needs to:
1. Continue growing revenue consistently, ideally through higher-margin offerings. 2. Improve operating leverage, converting revenue gains into profit. 3. Reduce reliance on debt, possibly through equity raising or retained earnings (when profitable). 4. Closely manage cash burn, preserving liquidity as revenue stabilizes.
Industry Overview
The industry has grown on the back of increased loan volumes and elevated interest rates. A high-interest rate environment has allowed non-bank lenders to charge higher rates, boosting their revenue. Yet, it has also hiked their funding costs, hindering profitability as net interest margins plunged. The mortgage war in 2023 saw authorised deposit-taking institutions (ADIs) offer competitive rates and attractive packages like cashback. This trend intensified competition and squeezed non-bank lenders' margins in the mortgage segment. Non-bank lenders have attracted a broader consumer base by offering flexible lending terms and user-friendly platforms. They have also filled the service gap left by traditional lenders because of tight lending standards, like increased capital requirements and serviceability buffers.
Trends and Insights
Non-bank lenders have capitalised on the high interest rate environment by charging more for loans, boosting revenue. Yet, high interest rates also ramped up borrowing expenses, pressuring lenders' net interest margins and profitability. Interest rate drops are bringing businesses back to commercial loans. Falling rates have made borrowing more affordable and encouraged businesses to resume expansions and projects that had stalled during more challenging times. Population centres like Melbourne and Sydney attract general financiers thanks to their high population and business levels. Business hubs like New South Wales and Victoria account for the highest proportions of non-ADIs in Australia. Restrictive limits on ADIs have made non-depository financing more appealing. This has prompted an influx of lenders, lowering market share concentration while intensifying competition and buyer power.
Source: IBIS World
Risk Analysis
Wisr Limited operates in Australia’s highly competitive consumer lending and fintech landscape, which exposes it to several structural and cyclical risks. Credit risk remains a key concern, as Wisr’s unsecured personal loan portfolio is sensitive to changes in borrower credit quality, particularly in an environment of elevated interest rates, cost-of-living pressures, and potential economic slowdown. Any deterioration in employment conditions could increase arrears and impairments. Funding and liquidity risk is also relevant, given Wisr’s reliance on warehouse facilities and capital markets to fund loan growth; tighter credit markets or higher funding costs could pressure margins. In addition, regulatory risk persists, as changes in consumer credit regulation, responsible lending obligations, or ASIC scrutiny could increase compliance costs or constrain growth. Technology and execution risk, including platform scalability, data security, and the ability to maintain customer trust, further adds to operational uncertainty.
Outlook
Wisr Limited’s outlook is constructive, offering meaningful growth potential balanced against near-term macroeconomic and funding-related challenges. Over the medium term, Wisr may be positioned to benefit from the structural shift toward digital lending, rising consumer acceptance of fintech platforms, and its focus on near-prime borrowers underpinned by data-driven credit assessment. Ongoing investment in technology, product diversification, and strategic partnerships should support loan book growth and operating leverage as economic conditions stabilize. In the near term, performance will continue to be influenced by credit quality trends, funding costs, and management’s ability to balance growth with disciplined risk management. Successful navigation of the credit cycle, stable access to competitively priced funding, and clear progress toward sustainable profitability would materially strengthen Wisr’s long-term investment case.
Historical Forecast and Assumptions
For FY26, we expect Wisr to transition from recovery to scalable growth. The company ended FY25 with a loan book of approximately $824 million, underpinned by a strong Q4 origination rebound. Management’s updated FY26 guidance, combined with a recent capital raise, signals an intention to accelerate originations and achieve profitability in H2 FY26. We forecast continued momentum in vehicle and personal loans, driving the FY26 closing loan book above $1.0 billion. Revenue was expected to grow strongly—potentially 35–50% year-on-year—as improved pricing, better funding margins, and higher fee income lift net interest margins. With operating leverage and ongoing cost discipline, Wisr is well placed to deliver positive EBITDA in FY26 and move toward cash NPAT profitability in the second half. Upside risks include stronger-than-expected loan growth and margin expansion, while key downside risks remain funding cost volatility, weaker origination trends, higher credit losses, or dilution from additional capital raises.
Technical Analysis
Historical Investment Assessment
Wisr Limited offers a selectively attractive investment opportunity as it transitions from recovery toward scalable growth. Structural tailwinds from digital lending adoption, improving loan origination momentum, and enhanced pricing and funding efficiency support its medium-term outlook. While near-term risks remain around funding costs, credit quality, and execution discipline, the company’s strengthening loan book, operating leverage, and clear pathway toward profitability in H2 FY26 point to improving fundamentals. Successful execution on growth initiatives and disciplined risk management will be critical to unlocking long-term shareholder value. From a technical perspective, the stock has entered a sideways consolidation phase following a positive price move over recent weeks. Despite this near-term range-bound behavior, the broader trend remains constructive. On a medium-term basis, the weekly chart still show a pattern of higher highs and higher lows, reinforcing the underlying bullish structure. Current price levels are well underpinned by key momentum indicators and the 200-day simple moving average (SMA), suggesting the stock remains positioned for a potential continuation of its upward trajectory in the short to medium term. the original research recommended a “BUY” at the closing price of $0.031 (as of 7th January 2026) with stop loss $0.018 for target $0.060.
This page adapts a historical research document and retains the original report date, company data and contemporaneous views. Market prices, financial information, forecasts, targets, stop-loss levels and recommendations may be outdated and have not been independently verified or updated by Sharesrise. References to research opinions are descriptions of the historical source, not newly issued Sharesrise recommendations.
This material is general information only and does not take account of any individual’s financial objectives, situation or needs. Securities, particularly smaller-capitalisation companies, involve substantial risk, including loss of capital. Past performance is not a reliable indicator of future performance. Seek appropriate professional advice and review current ASX announcements before making decisions. Sharesrise must obtain legal/compliance approval of this disclosure and the report rights before public release; this text does not assert an AFSL, CAR or other authorisation.